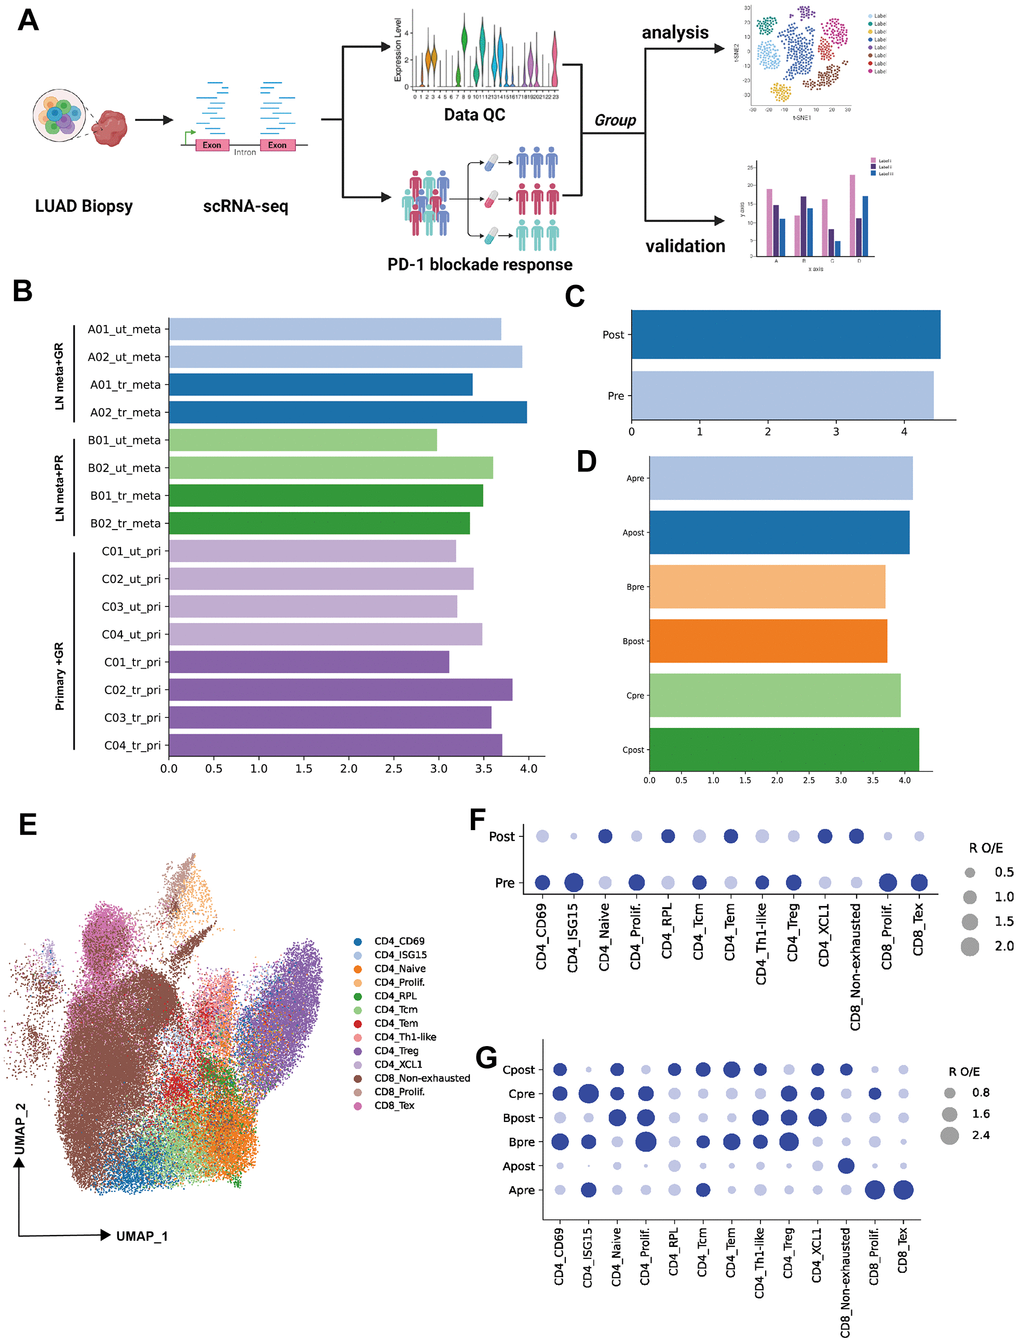
Figure 1.Single-cell transcriptional analysis of T lymphocytes from LUAD patient biopsies. (A) Schematic showing the analysis of procedures used for this study (created using BioRender.com). (B) Bar plot showing the cell number (Log10 transformed) of samples selected from primary patients’ data (ut: untreatment; tr: treatment; meta: lymph node or liver metastasis; pri: primary tumor). (C) Bar plot showing the cell number (Log10 transformed) of pre-PD-1 blockade therapy and post-PD-1 blockade therapy. (D) Bar plot showing the cell number (Log10 transformed) of groups which were defined by biopsy sites (metastasis or primary tumor) and response of PD-1 blockade therapy (good or poor response). (E) Two-dimensional UMAP plot of single-cell RNA-Seq (scRNA-Seq) performed on groups A, B, and C after PD-1 blockade therapy (horizontal axis: UMAP_1, vertical axis: UMAP_2). (F) Patient group preference for each CD4 and CDD8 subcluster measured using the RO/E index (dark blue: enrichment, light blue: depletion).