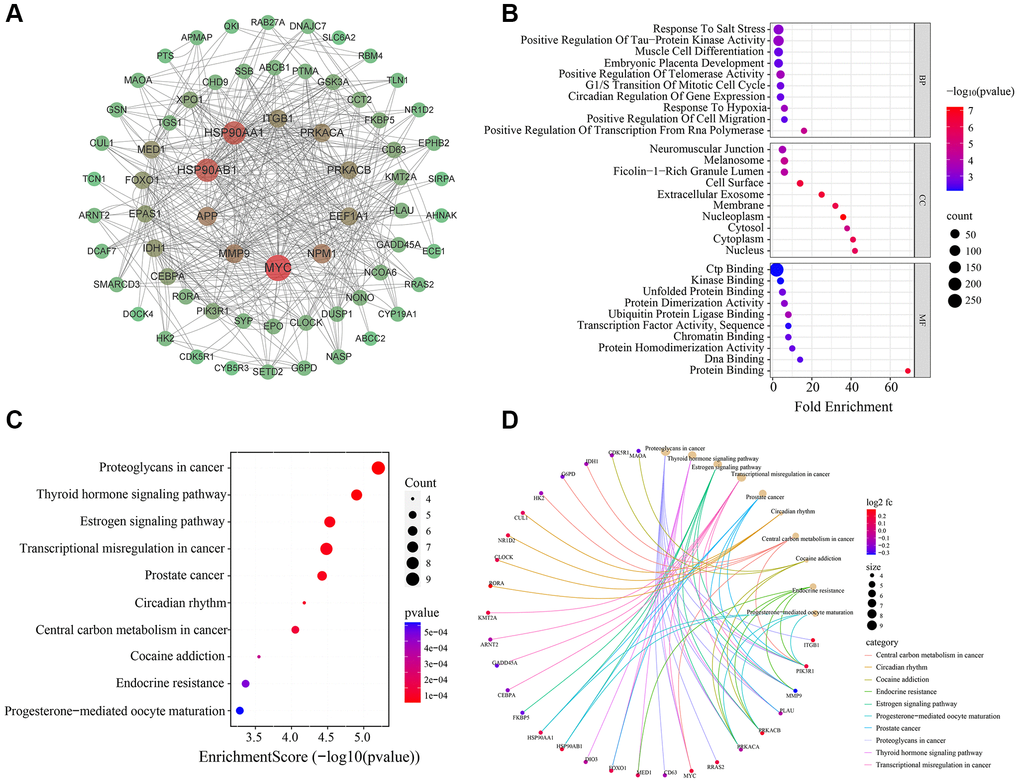
Figure 4.Bioinformatics analysis of 75 MDD-related CRGs. (A) PPI network of 75 MDD-related CRGs. Nodes represent targets and edges represent interactions. (B) Bubble chart of GO enrichment results. (C) Bubble chart of KEGG pathway enrichment results. (D) Enrichment plot of targets in pathways.