Submit an Article
Navigate
Home
Editorial Board
Editorial Policies
Current Volume
Archive
Scientific Integrity
Publication Ethics Statements
Interviews with Outstanding Authors
Newsroom
Sponsored Conferences
Podcast
Contact
Special Collections
Submit an Article
Online ISSN: 1945-4589
Research Paper
|
Volume 16, Issue 12
|
pp. 10299–10320
Mining key circadian biomarkers for major depressive disorder by integrating bioinformatics and machine learning
Back to article
Figure 2
(2 of 10)
−
100%
+
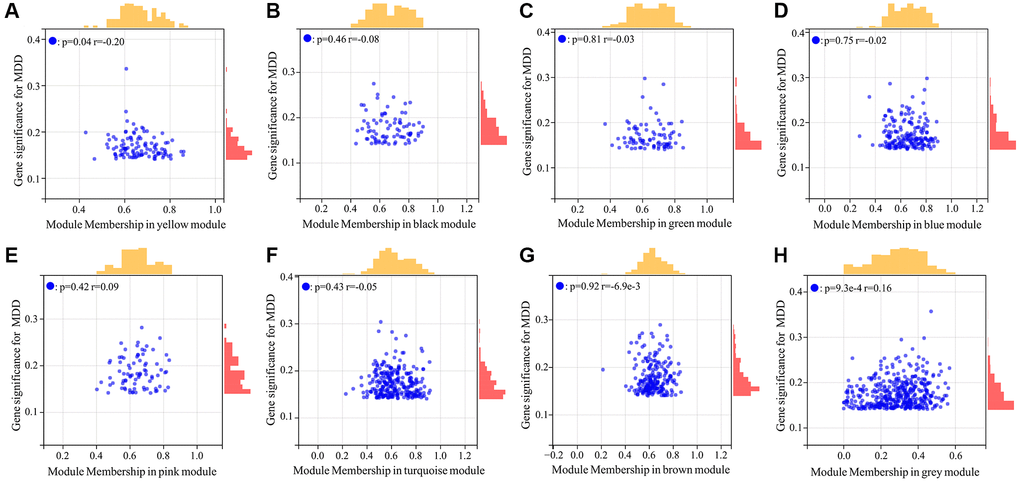
Figure 2.
Scatter plot analysis of hub genes highly associated with MDD from 8 co-expressed gene modules.
(
A
–
H
) Represented yellow, black, green, blue, pink, turquoise, brown, grey module respectively.