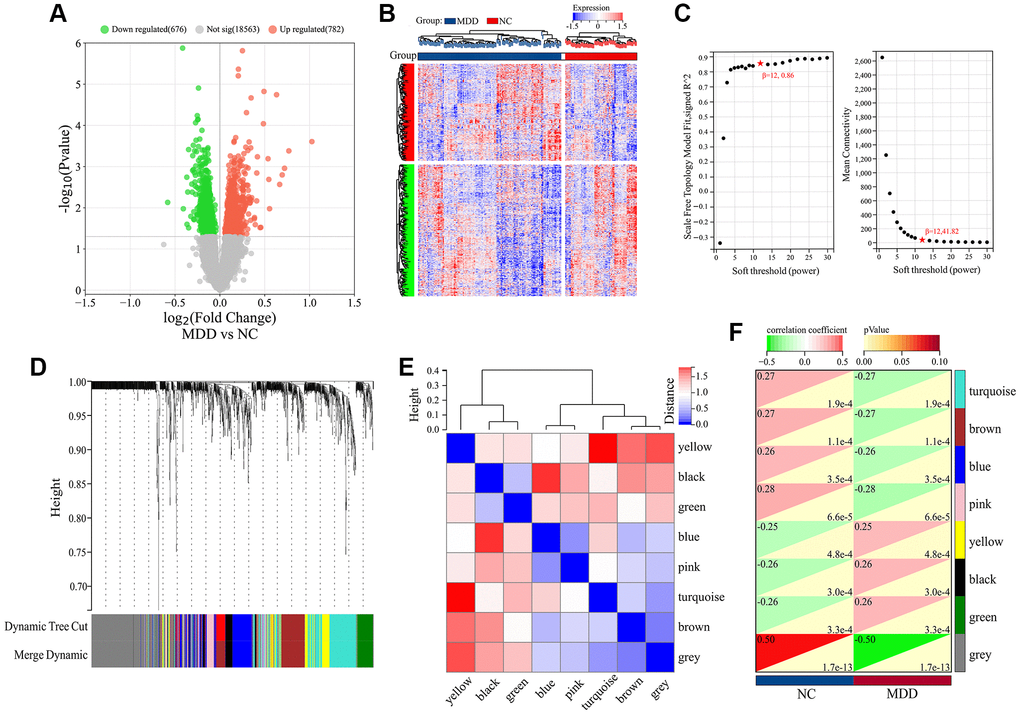
Figure 1.Differential expression and WGCNA analysis of DEGs in GSE98793 dataset. (A) Volcano plot of DEGs. (B) Hierarchical clustering of DEGs. (C) Scale independence and Mean connectivity as a function of soft-thresholding powers. (D) Cluster dendrogram. (E) Heatmap based on gene connectivity of modules. (F) Heatmap of clinical-trait associations.