Submit an Article
Navigate
Home
Editorial Board
Editorial Policies
Current Volume
Archive
Scientific Integrity
Publication Ethics Statements
Interviews with Outstanding Authors
Newsroom
Sponsored Conferences
Podcast
Contact
Special Collections
Submit an Article
Online ISSN: 1945-4589
Research Paper
|
Volume 16, Issue 12
|
pp. 10252–10270
Characterization of tumor endothelial cells (TEC) in gastric cancer and development of a TEC-based risk signature using single-cell RNA-seq and bulk RNA-seq data
Back to article
Figure 8
(8 of 10)
−
100%
+
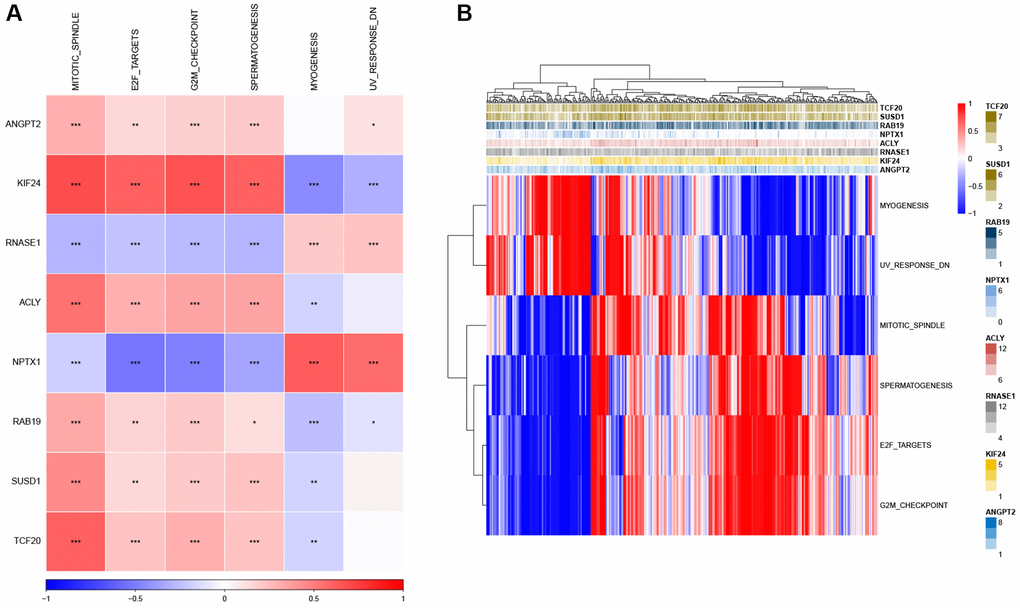
Figure 8.
Identification of the pathways in which the risk genes are implicated.
(
A
) Heatmap showing the correlation between genes and pathways. (
B
) Heatmap displaying the enrichment scores for key pathways.
*
P
< 0.05,
**
P
< 0.01,
***
P
< 0.001.