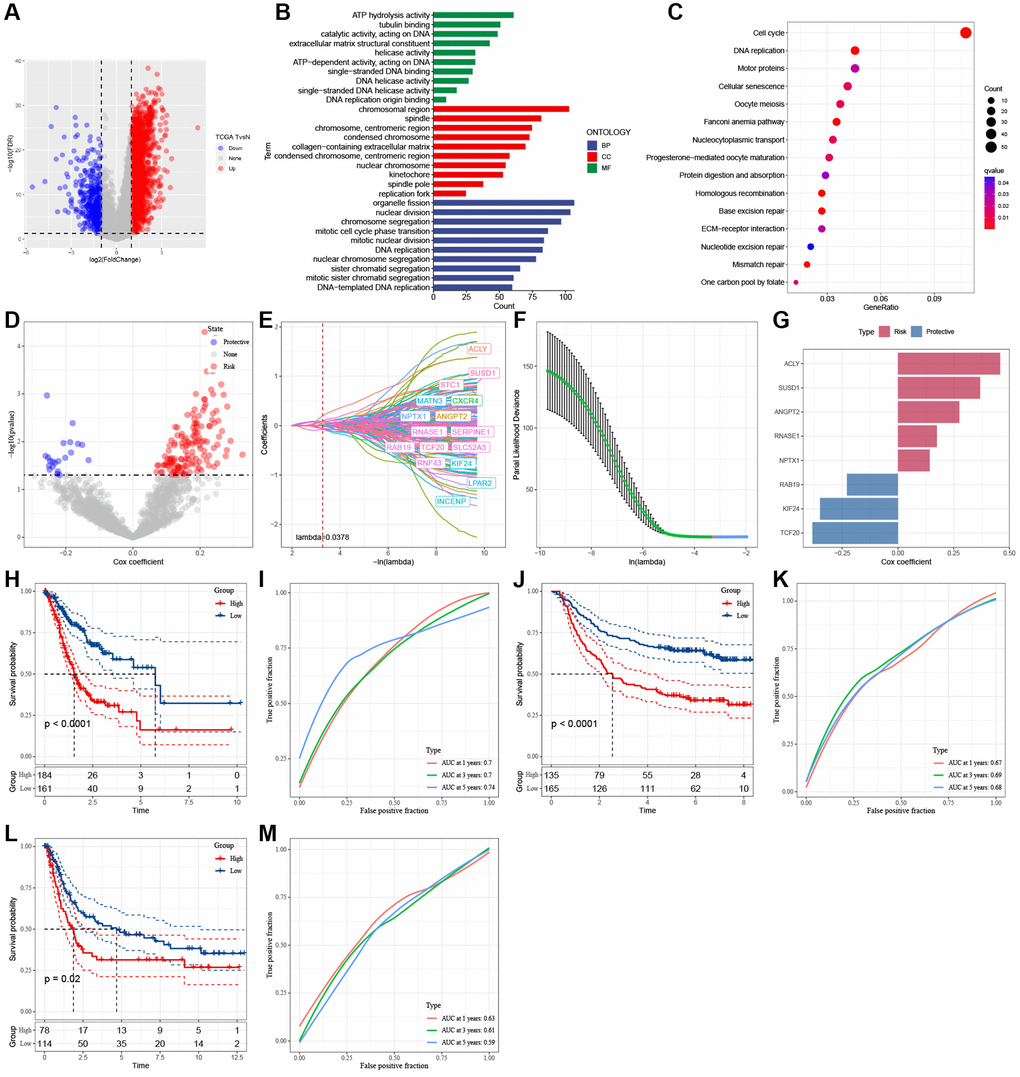
Figure 5.Identification of the hub genes to construct a risk signature. (A) Volcano plot of differentially expressed genes of cancer and normal tissues in TCGA cohort. (B) GO analysis. (C) KEGG analysis. (D) Volcano plot of prognosis-related genes identified from univariate Cox regression analysis. (E) The trajectory of each independent variable with lambda. (F) Plots of the produced coefficient distributions for the logarithmic (lambda) series for parameter selection (lambda). (G) The multivariate Cox coefficients for each gene in the risk signature. (H) K-M curves of risk model constructed by 8 genes in TCGA cohort. (I) ROC curves of risk model constructed by 8 genes in TCGA cohort. (J) K-M curves of risk model constructed by 8 genes in GSE62254 cohort. (K) ROC curves of risk model constructed by 8 genes in GSE62254 cohort. (L) K-M curves of risk model constructed by 8 genes in GSE15459 cohort. (M) ROC curves of risk model constructed by 8 genes in GSE15459 cohort.