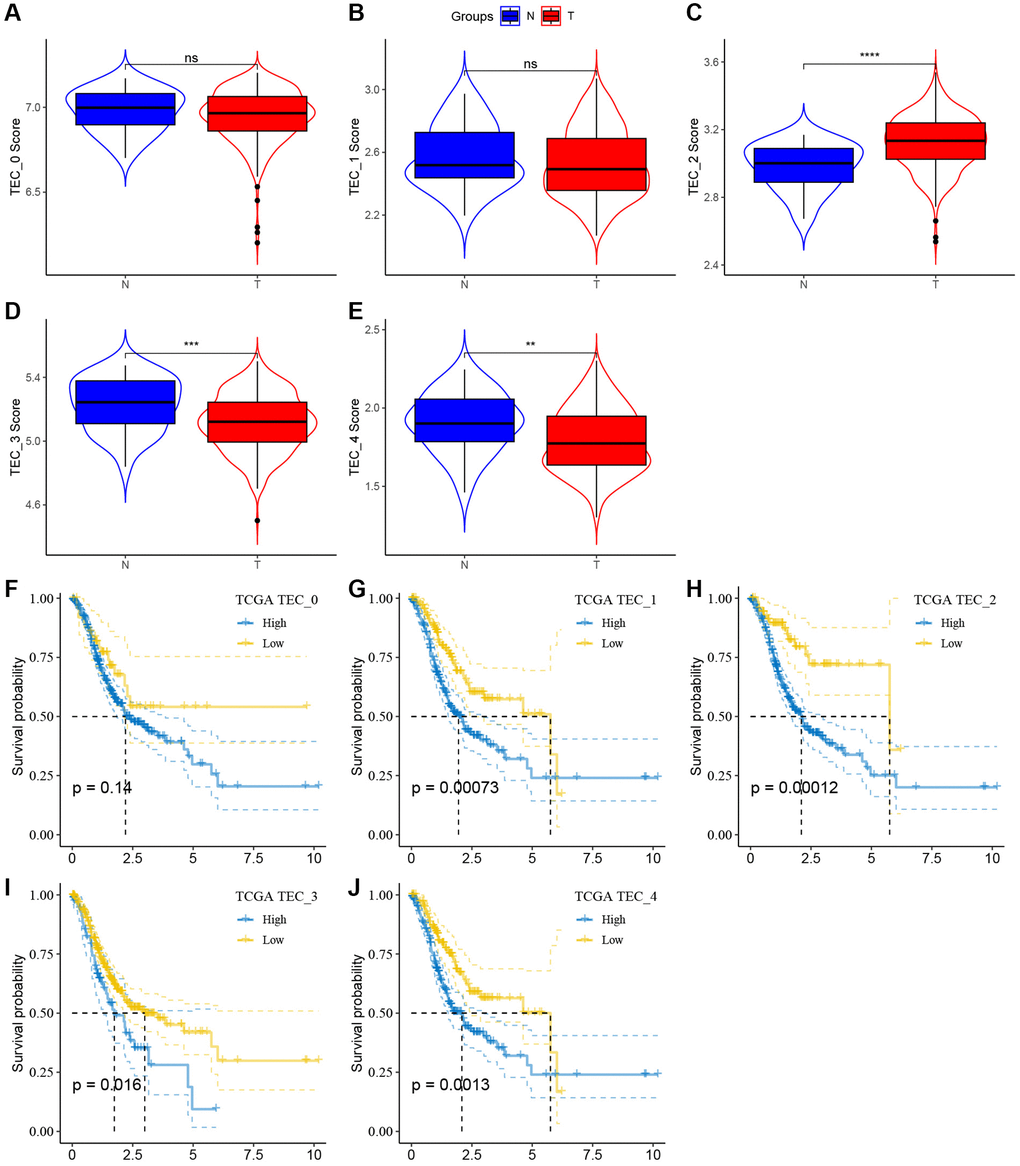
Figure 4.The associations between the five TEC cluster and prognosis of GC patients. (A–E) Comparison of five TEC scores in cancer and normal tissues, **P < 0.01, ***P < 0.001, ****P < 0.0001, Abbreviation: ns: not significant. (F–J) K-M curves of the high and low TEC score groups in the TEC_0 cluster (F), TEC_1 cluster (G), TEC_2 cluster (H), TEC_3 cluster (I), and TEC_4 (J).