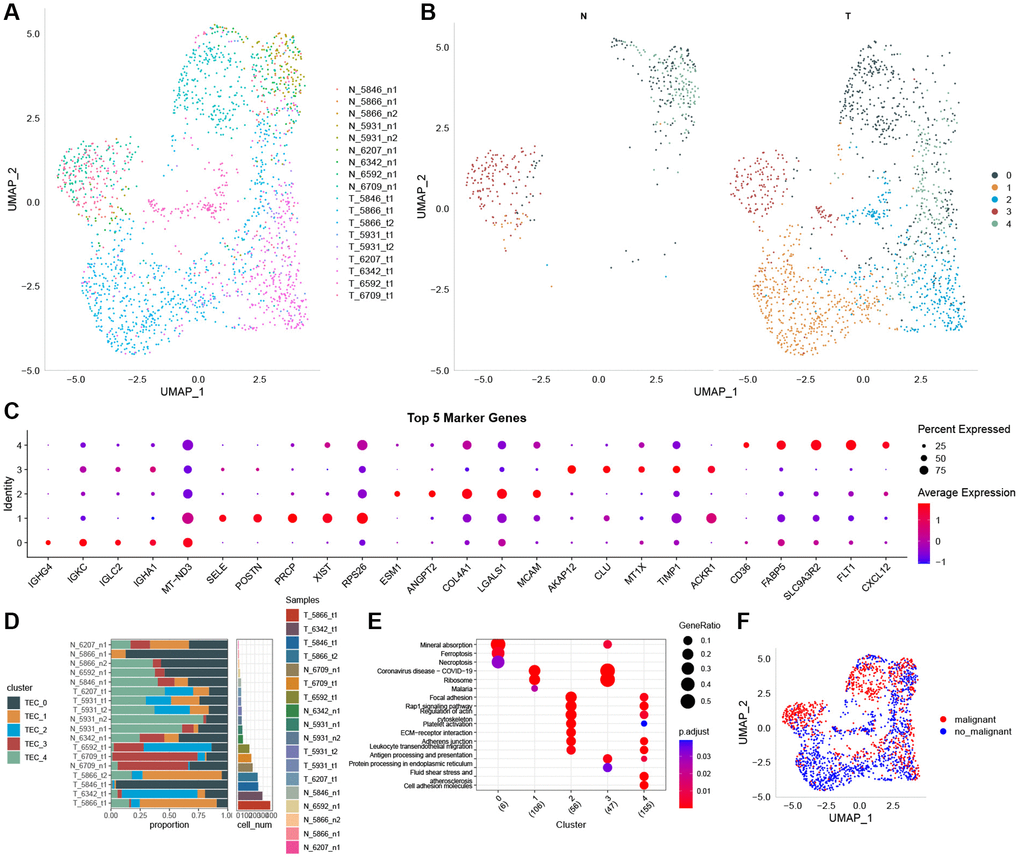
Figure 2.The identification of TEC clusters based on scRNA seq data of GC patients. (A) UMAP plot of the distribution of 18 samples. (B) UMAP plot of the distribution of five TEC clusters after clustering. (C) Dot plot of the top 5 marker gene expression of TEC clusters. (D) The proportion of the five TEC clusters in tumor samples and normal samples. (E) KEGG enrichment analysis of 5 TEC clusters. (F) UMAP distribution map of malignant and non-malignant cells predicted by Copykat package.