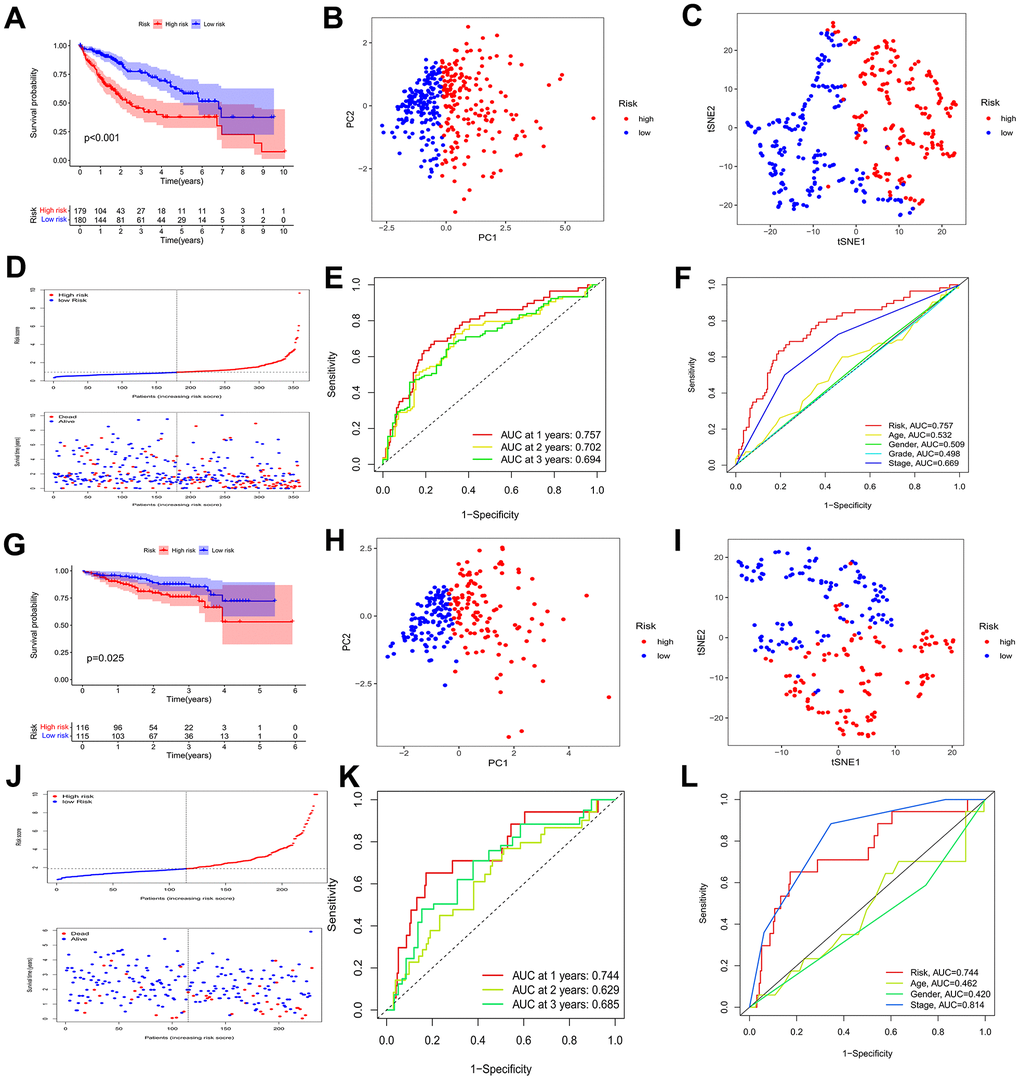
Figure 4.Identification of a prognostic risk model for HCC patients. (A) Kaplan–Meier curve of HCC patients in the TCGA cohort. (B, C) PCA and t-SNE analysis showing a remarkable difference in transcriptomes between the two risk categories in the TCGA cohort. (D) Scatter plots showing the risk score distribution and patient survival status in TCGA cohort. (E) ROC curves to predict the sensitivity and specificity of 1-, 2-, 3-year survival according to the risk score in the TCGA cohort. (F) Clinical ROC analysis in the TCGA cohort. (G) Kaplan–Meier curve of HCC patients in the ICGC cohort. (H, I) PCA and t-SNE analysis showing a remarkable difference in transcriptomes between the two risk categories in the ICGC cohort. (J) Scatter plots showing the risk score distribution and patient survival status in the ICGC cohort. (K) ROC curves to predict the sensitivity and specificity of 1-, 2-, 3-year survival according the risk score in the ICGC cohort. (L) Clinical ROC analysis in the ICGC cohort.