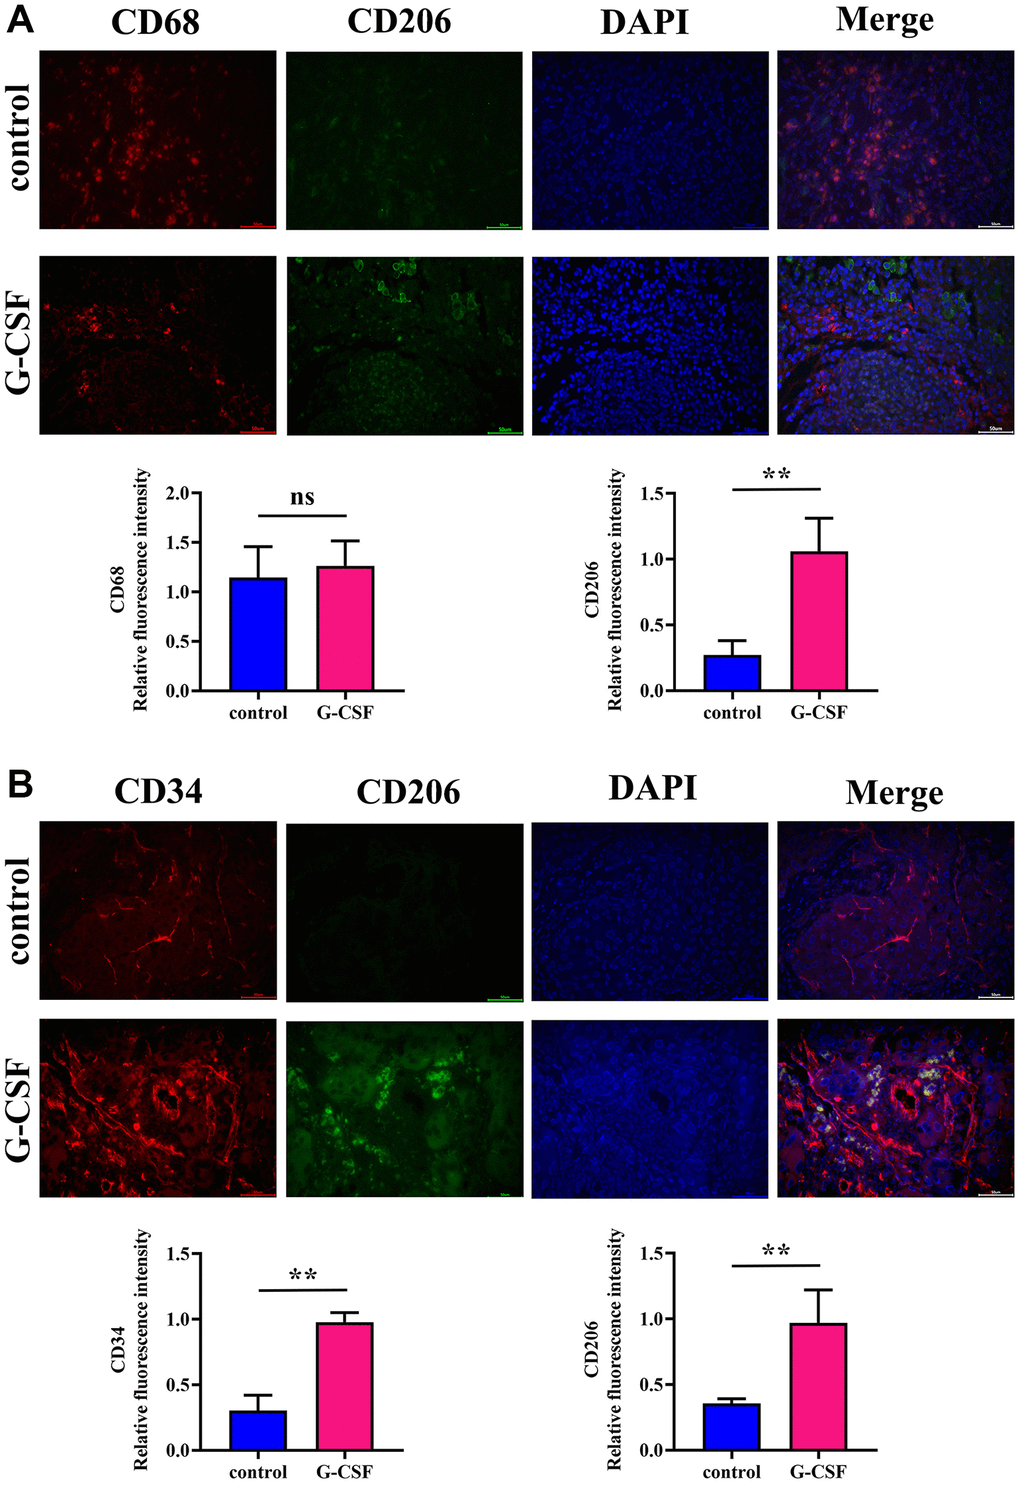
Figure 2.Assessment of M2-type macrophage expression and angiogenic quantification in neoplastic tissues via immunofluorescence. (A) Detection of Mannose (depicted in green)/CD68 (depicted in red) expression levels within neoplasm-bearing tissues. (B) Detection of CD34 (depicted in red)/Mannose (depicted in green) expression levels within neoplasm-bearing tissues. The P-value is less than 0.05.