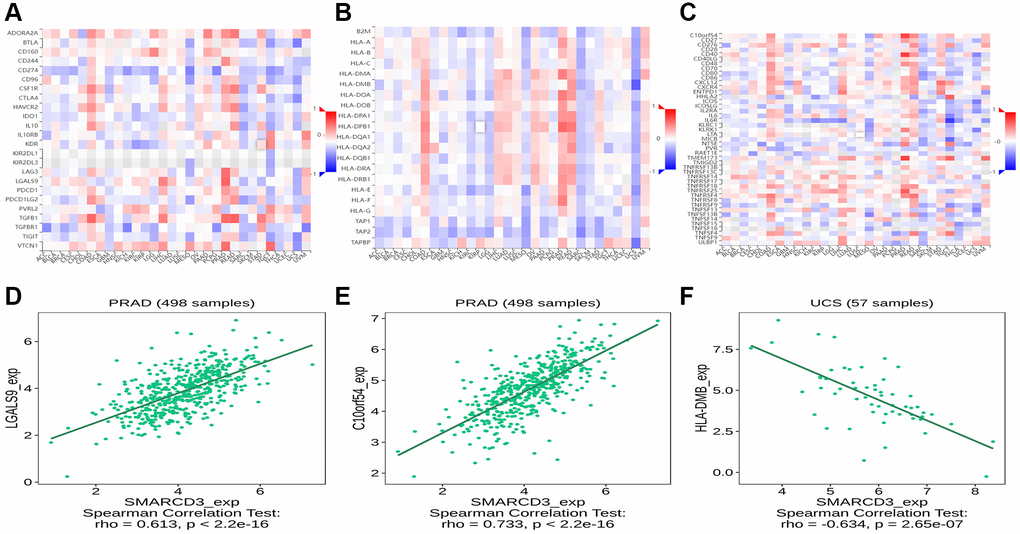
Figure 4.Correlation analysis between SMARCD3 and immune-related genes. (A) Correlation heat map of SMARCD3 and Immunoinhibitor; (B) Correlation heat map of SMARCD3 and Immunostimulator; (C) Correlation heat map of SMARCD3 and MHC; (D) Correlation map of SMARCD3 and LGALS9 in PRAD; (E) Correlation map of SMARCD3 and C10or54 in PRAD; (F) Correlation map of SMARCD3 and HLA-DMB in UCS.