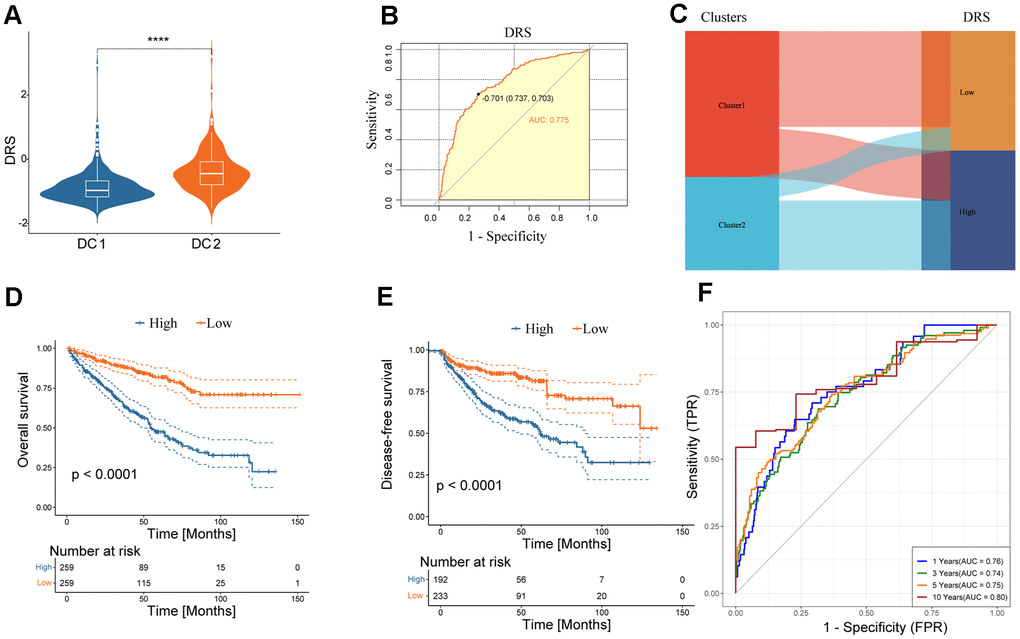
Figure 6.Clinical significance of DRS. (A) Boxplots show DRS at two levels of disulfidptosis. ****p < 0.0001. (B) ROC curve analysis of the predictive value of DRS for disulfidptosis phenotypes. (C) Alluvial plot showing the association between DRS and disulfidoptosis phenotypes. (D, E) Survival analysis of overall survival (left) and disease-free survival (right) of the two DRS groups in the TCGA-KIRC dataset. (F) Time-dependent ROC analysis of the predictive value of DRS for the overall survival of patients at 1, 3, 5, and 10 years.