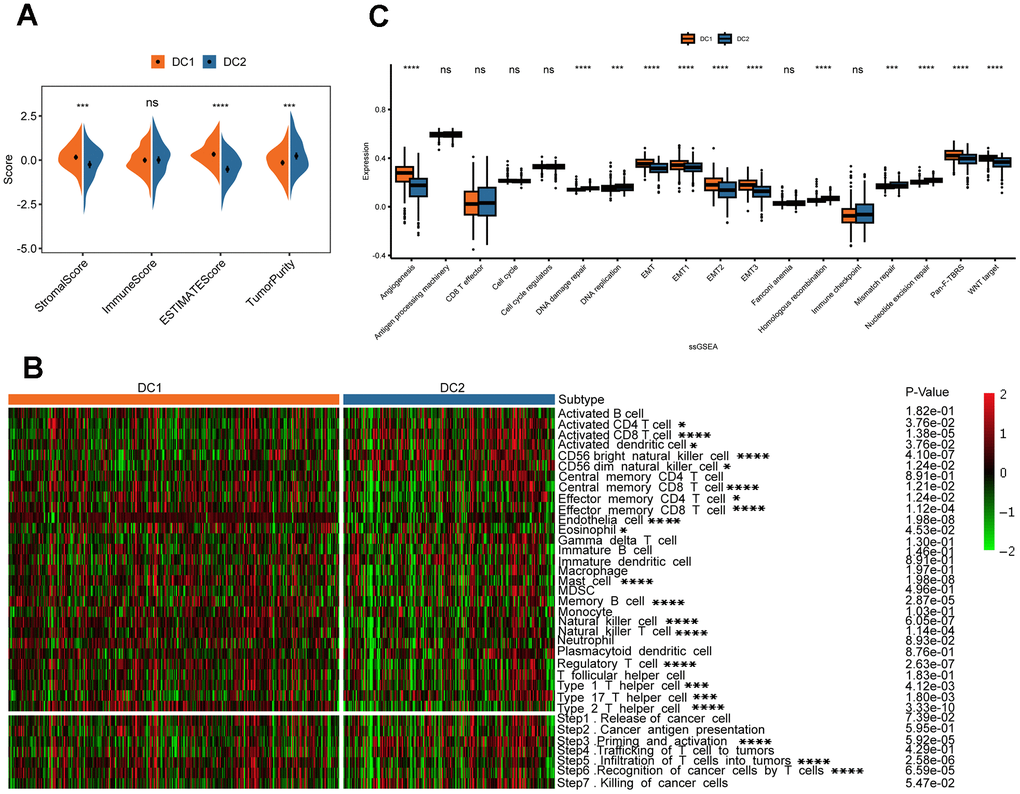
Figure 5.Variations in TME in the two disulfidptosis phenotypes. (A) The result of estimation between the two disulfidoptosis phenotypes from TCGA-KIRC datasets. ns, p > 0.05; ***p < 0.001, ****p < 0.0001. (B) The heatmap showing the frequency of TME-infiltrating cells and cancer immune cycle among the two disulfidoptosis phenotypes based on ssGSEA. (C) The Wilcox test was used to evaluate the TME-related scores of different disulfidoptosis patterns. ns, p > 0.05; ***p < 0.001, ****p < 0.0001.