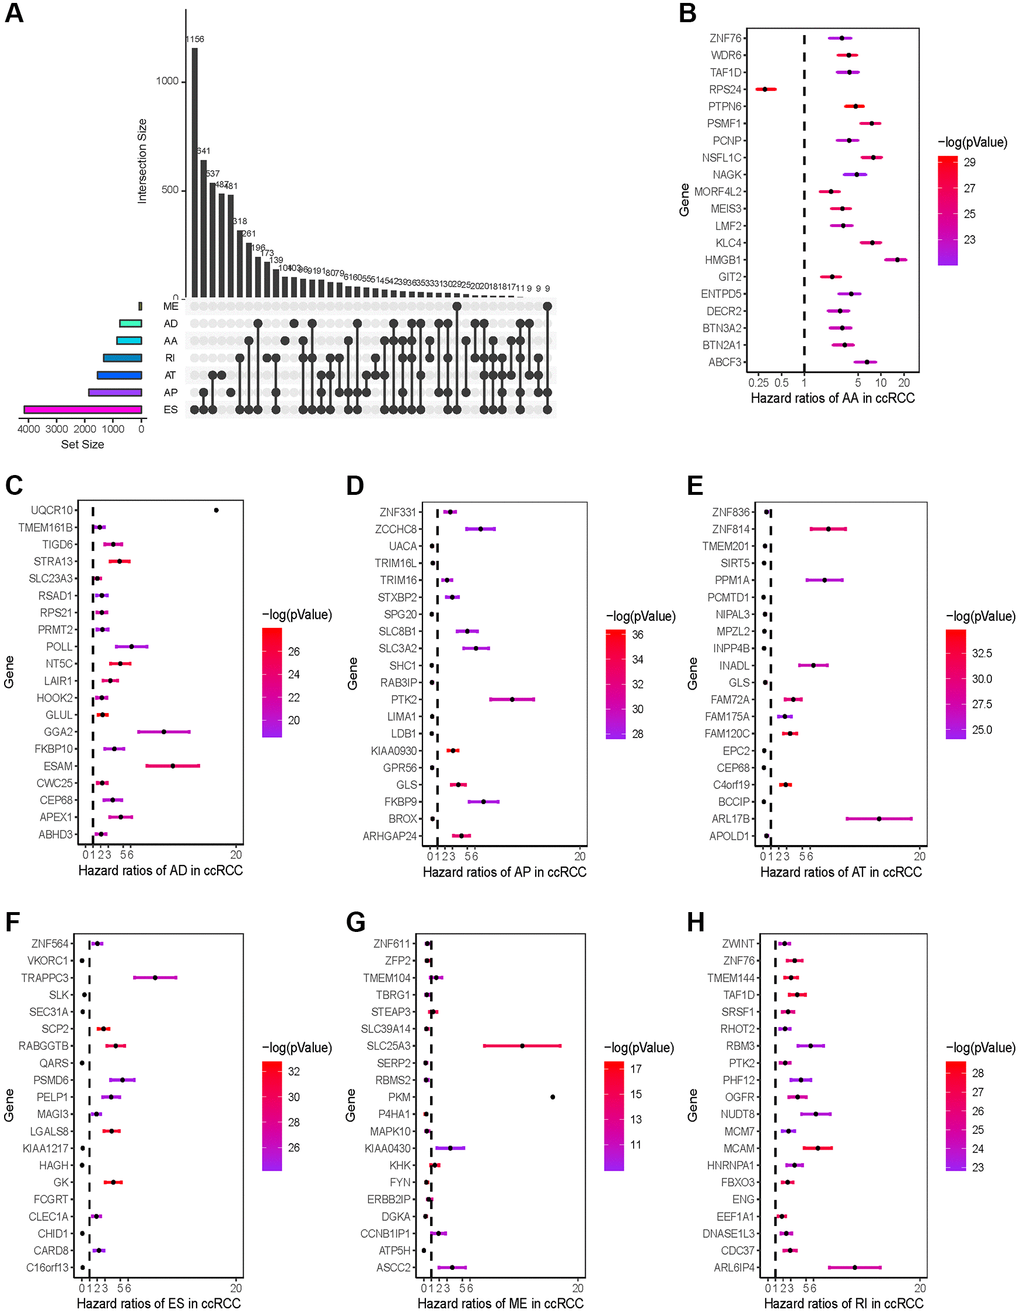
Figure 2.Prognosis-related AS events profiles. (A) Intersection UpSet plot of seven types of prognosis-related AS events in KIRC. (B–H) Forest plots of HRs of the top 20 prognostic-associated seven types of AS events. The color scale on the right side indicates the P-value.