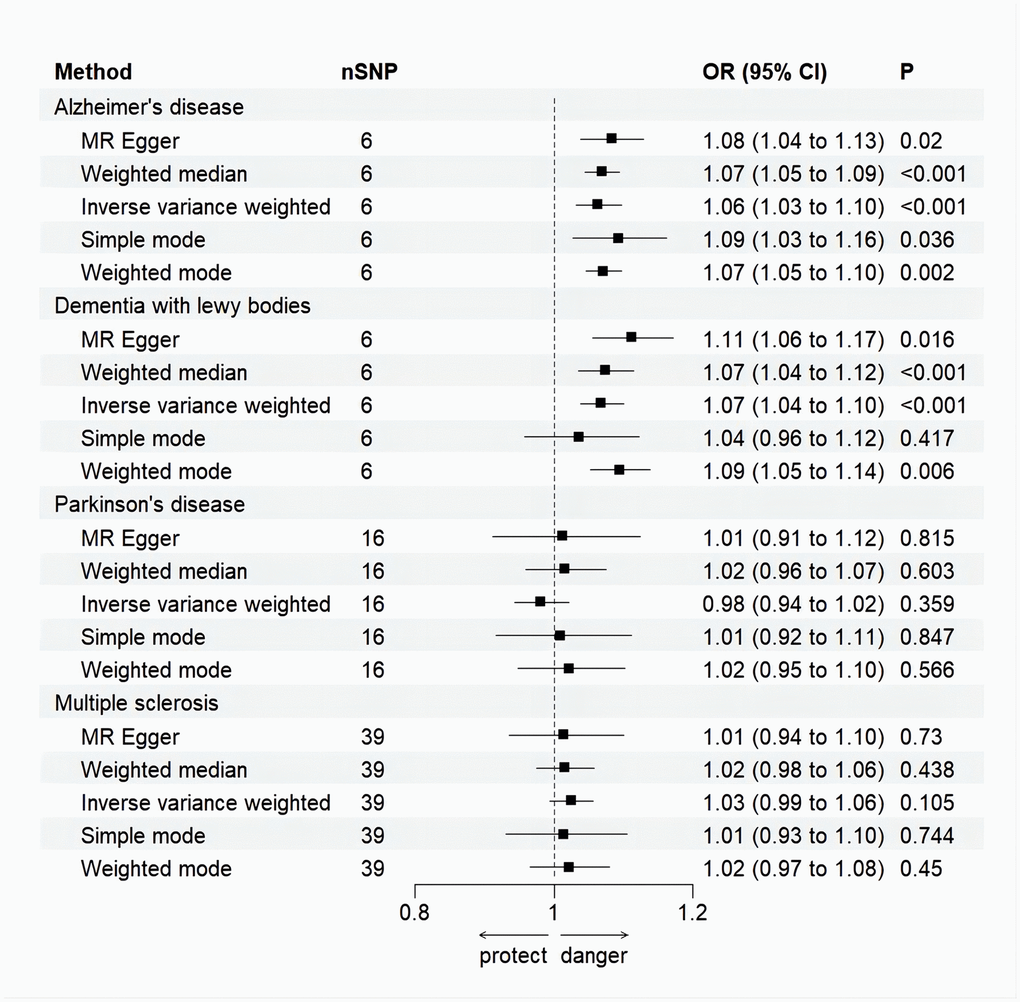
Figure 3.Forest plot for MR analysis causal effect of NDDs phenotypes on MI. Five methods: random-effects IVW, MR–Egger, WM, simple mode and weighted mode. IVW was used as the main method to analyze the causal relationship. OR are scaled to per genetically predicted 1 log-odds unit increase in the liability to NDDs. The standard line is the “X = 1” dotted line. P-value less than 0.05 is considered statistically significant. SNP, single nucleotide polymorphism; OR, odds ratio; CI, confidence interval; Error bars represent the 95% CI for the estimates.