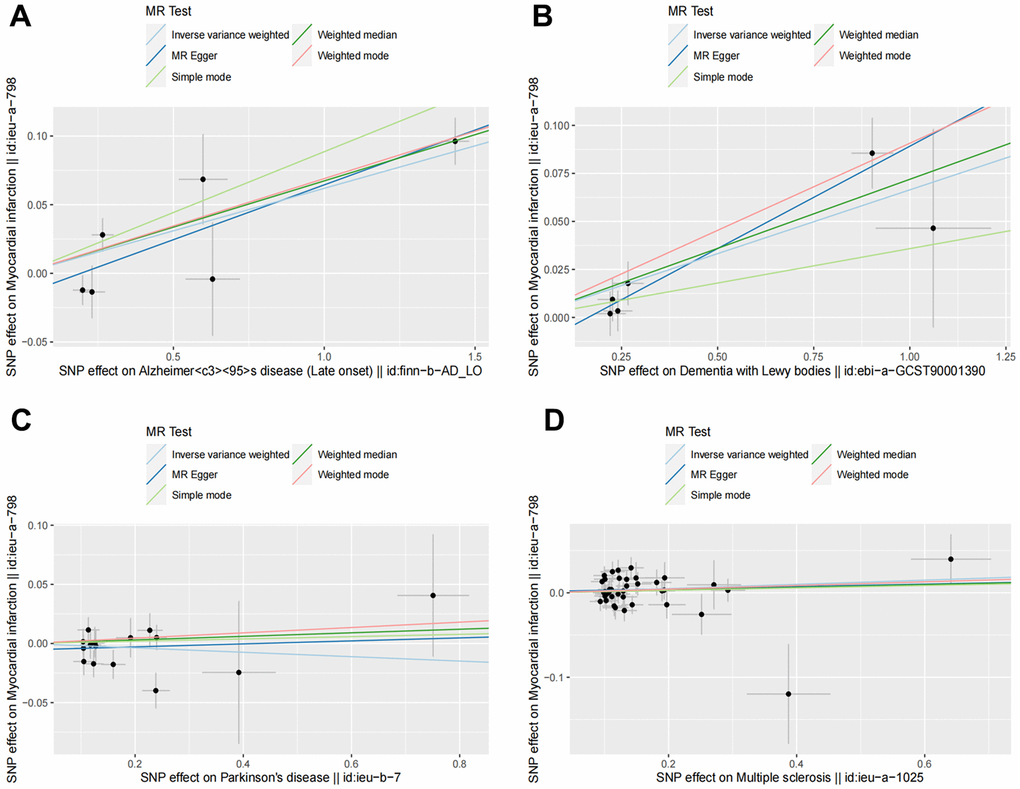
Figure 2.Scatter plots for MR analyses of the causal effect of NDDs phenotypes on MI. The vertical axis is the effect of SNP on MI and the horizontal axis is the effect of SNP on NDDs phenotypes. (A) AD-MI. (B) DLB-MI. (C) PD-MI. (D) MS-MI. Analyses were conducted using the conventional IVW, WM, MR-Egger, simple mode and weighted mode methods. The slope of each line corresponds to the estimated MR effect per method. MR, Mendelian randomization; IVW, inverse variance weighted; WM, weighted median.