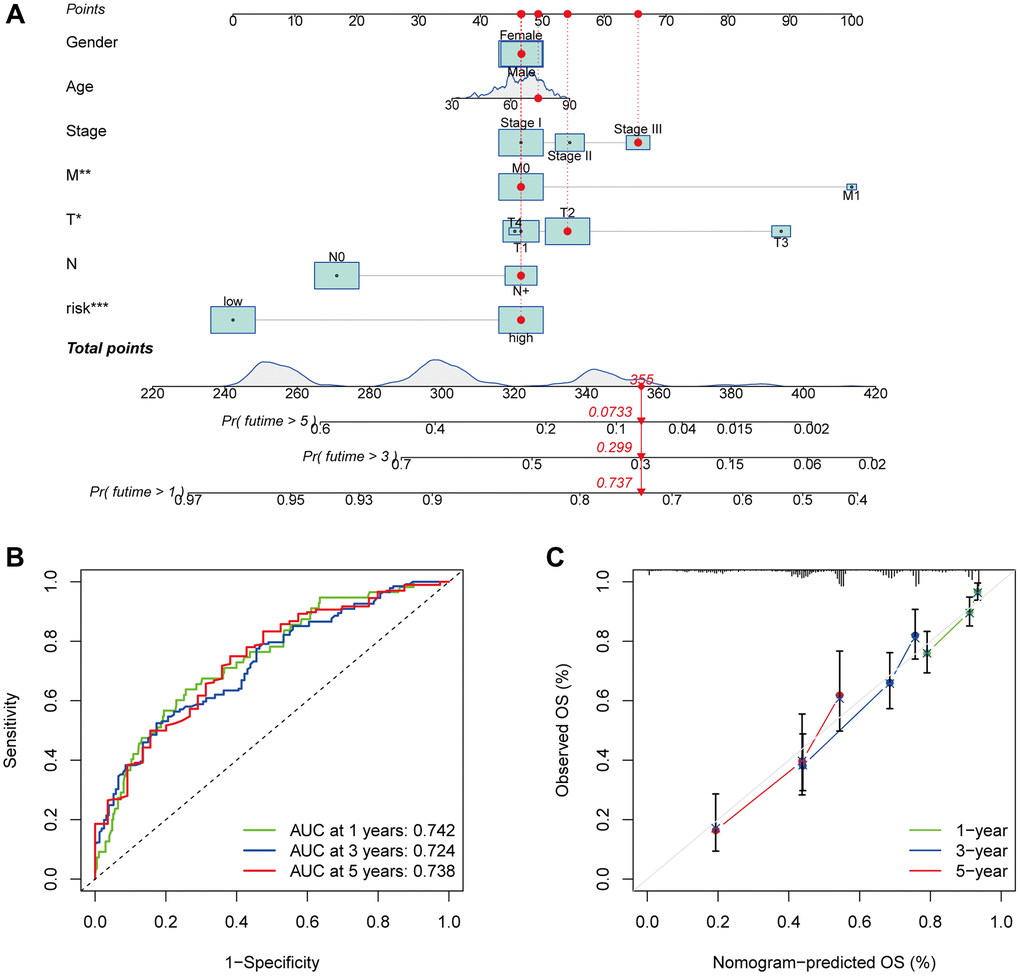
Figure 7.Survival and prognostic prediction using nomogram and clinical features in LUAD patients. An OS prediction nomogram for LUAD patients (A). The nomogram’s prognostic value was shown by the time-dependent ROC curves (B) and calibration curves (C) for 1, 3, and 5-year OS.