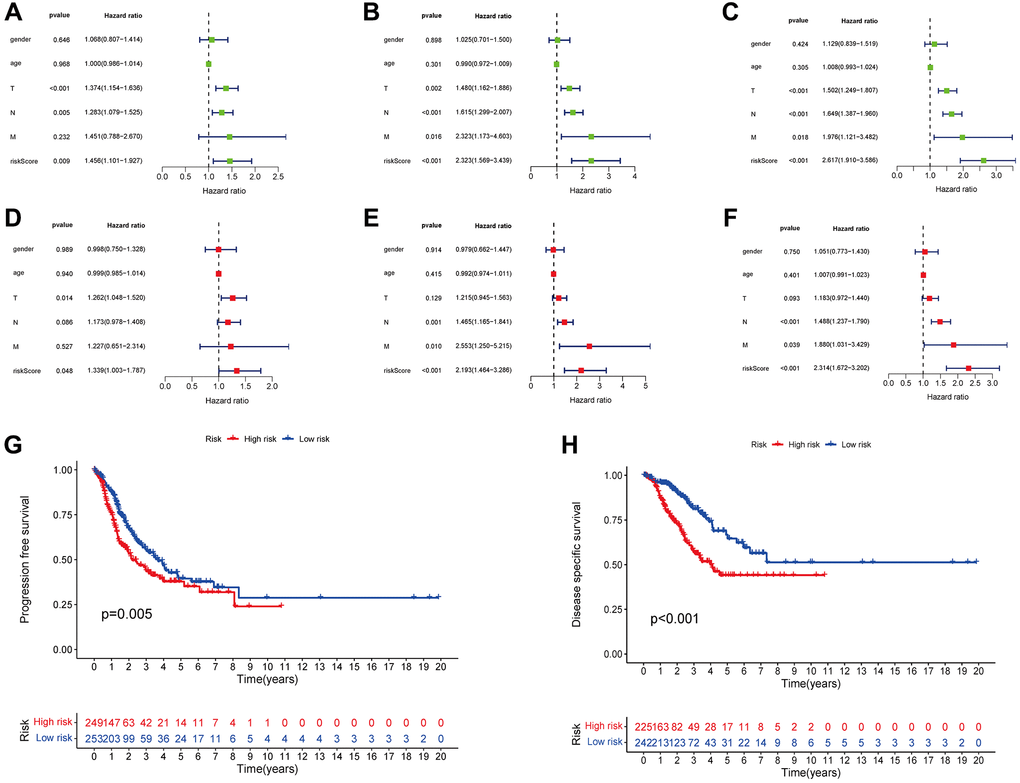
Figure 6.The risk score was correlated with PFS (A), DSS (B), and OS (C) as determined by univariate analysis, and multivariate analyses showed independently correlation between risk score and PFS (D), DSS (E), and OS (F). Variations in PFS and DSS between the groups with high- and low-risk scores are shown by the KM curves (G, H).