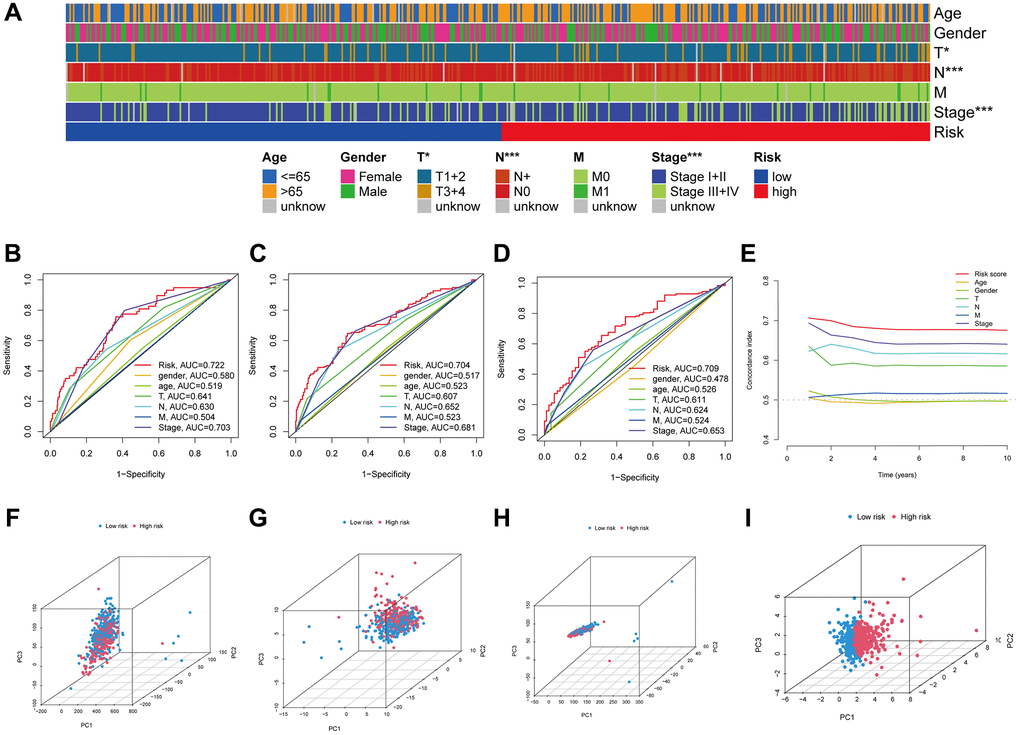
Figure 5.The LUAD signature’s predictive power. Visual representation of the variations in clinical characteristics between the high- and low-risk groups using a heatmap (A). The time-dependent ROC curves illustrate the risk score and clinical features’ predictive power for 1, 3, and 5 years OS (B–D). The risk score's concordance index was examined using C-index curves (E). Principal component analysis (PCA) in all genes, anoikis-related genes, anoikis-related lncRNAs and risk-related lncRNAs (F–I).