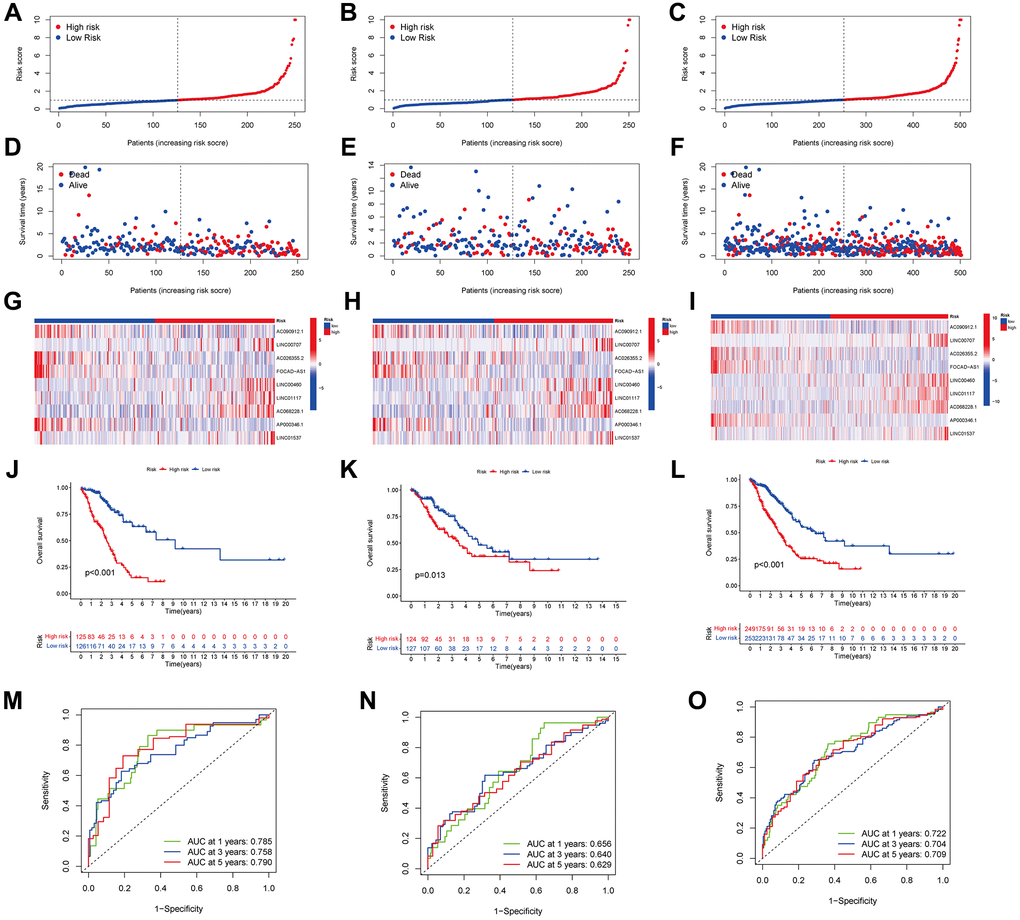
Figure 4.Predicting the performance of characteristics. The distribution of LUAD patients with varying risk scores in the training, testing, and entire sets is shown by the risk curves (A–C). The training, test, and entire set survival statuses of patients with differing risk scores (D–F). lncRNA characteristics in various datasets are shown by the heatmap (G–I). The three groups—training, testing, and the entire groups—are demonstrated via K-M curves that illustrate the overall survival (OS) of LUAD patients (J–L). The ARLSig’s predictive power for 1, 3, and 5-year OS in LUAD patients was demonstrated by the time-dependent ROC curves (M–O).