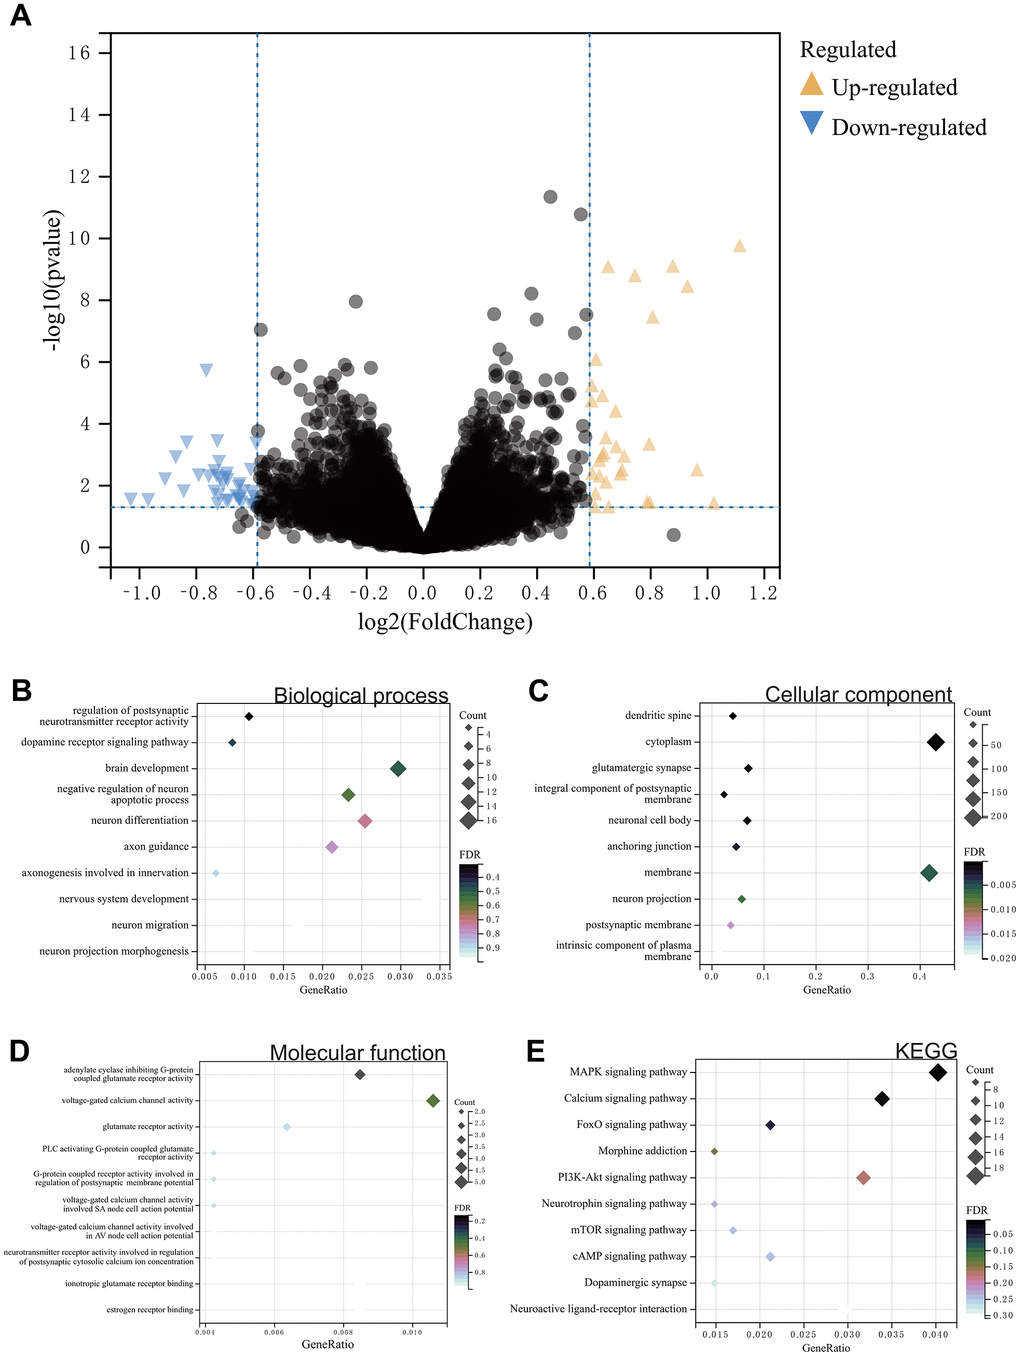
Figure 1.(A) Differential gene analysis. A total of 500 DEGs. (B–E) Results of GOKEGG enrichment analysis of DEGs. (B) Biological process analysis. (C) Cellular component analysis. (D) Molecular function analysis. (E) Results of KEGG enrichment analysis.