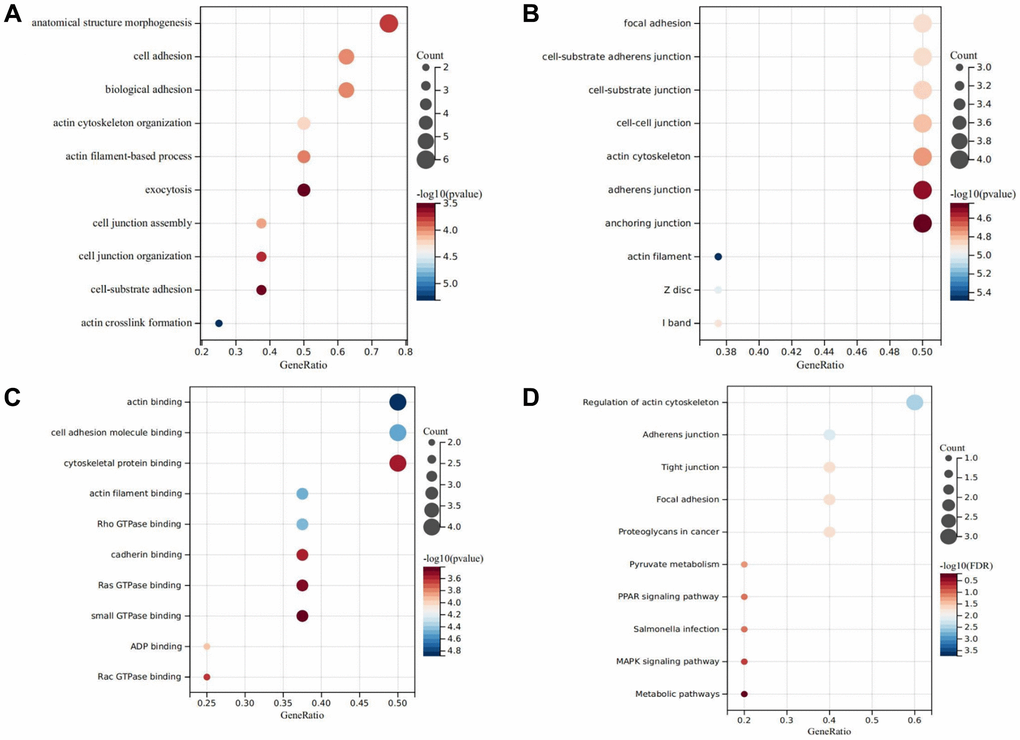
Figure 9.GO and KEGG analysis. (A) Represents the biological process bubble diagram of the DEDRGs in TCGA-THCA. (B) Represents the cellular component bubble diagram of the DEDRGs in TCGA-THCA. (C) Represents the molecular function bubble diagram of the DEDRGs in TCGA-THCA. (D) Represents the KEGG bubble diagram of the DEDRGs in TCGA-THCA. The bubble size represents the number of hub genes enrichment, and the color depth represents the level of significance.