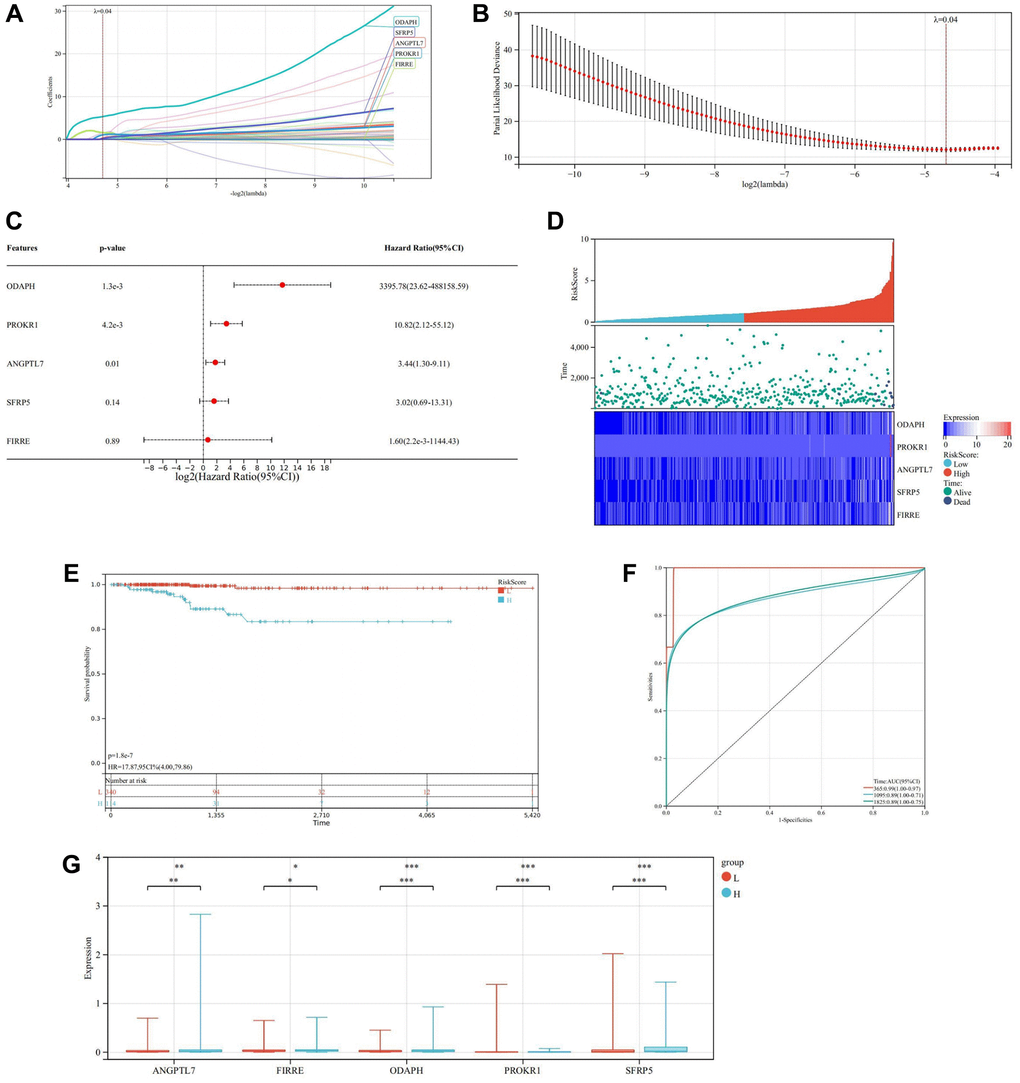
Figure 12.Construction and verification of prognostic model. (A) LASSO coefficient map of the prognostic genes. (B) After ten cross-verifications, the LASSO model of parameter selection is adjusted with minimum absolute shrinkage and selection. (C) Forest plot of the prognostic genes. (D) Heatmap of risk score. (E) Kaplan-Meier of high and low-risk group. (F) Predictive value of Cox prognostic model in THCA patients evaluated by ROC curves. (G) Box diagram of the prognosis genes expression in the high and low-risk groups.