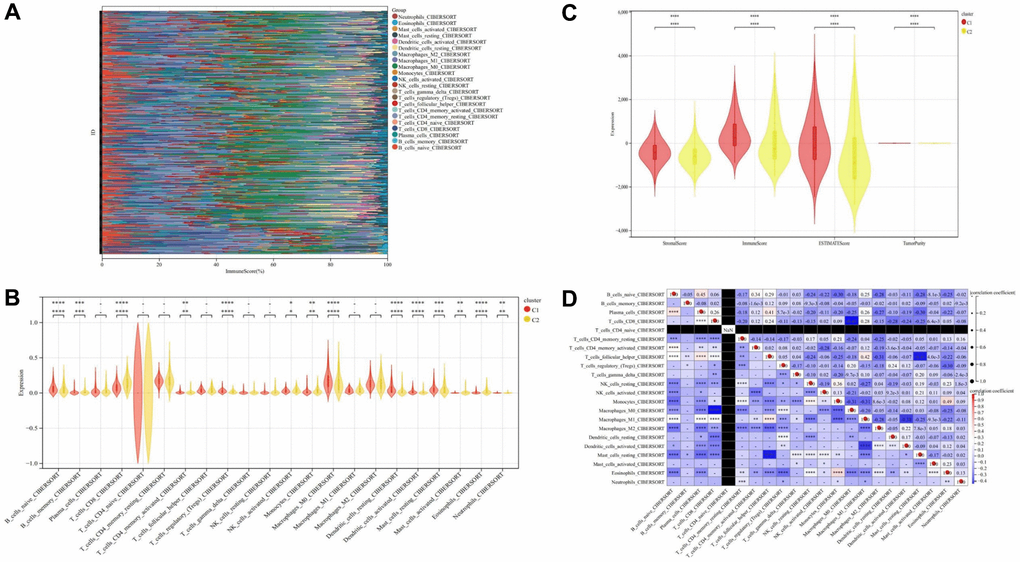
Figure 10.Immune cell infiltration analysis. (A) Stack diagram of immune cell infiltration. (B) Violin diagram of immune cell infiltration between cluster C1 and cluster C2. (C) Violin diagram of immune score between cluster C1 and cluster C2. (D) Heatmap of correlation analysis between immune cells. * represents P < 0.05, ** represents P < 0.01, *** represents P < 0.001, **** represents P < 0.0001, - represents no significant difference.