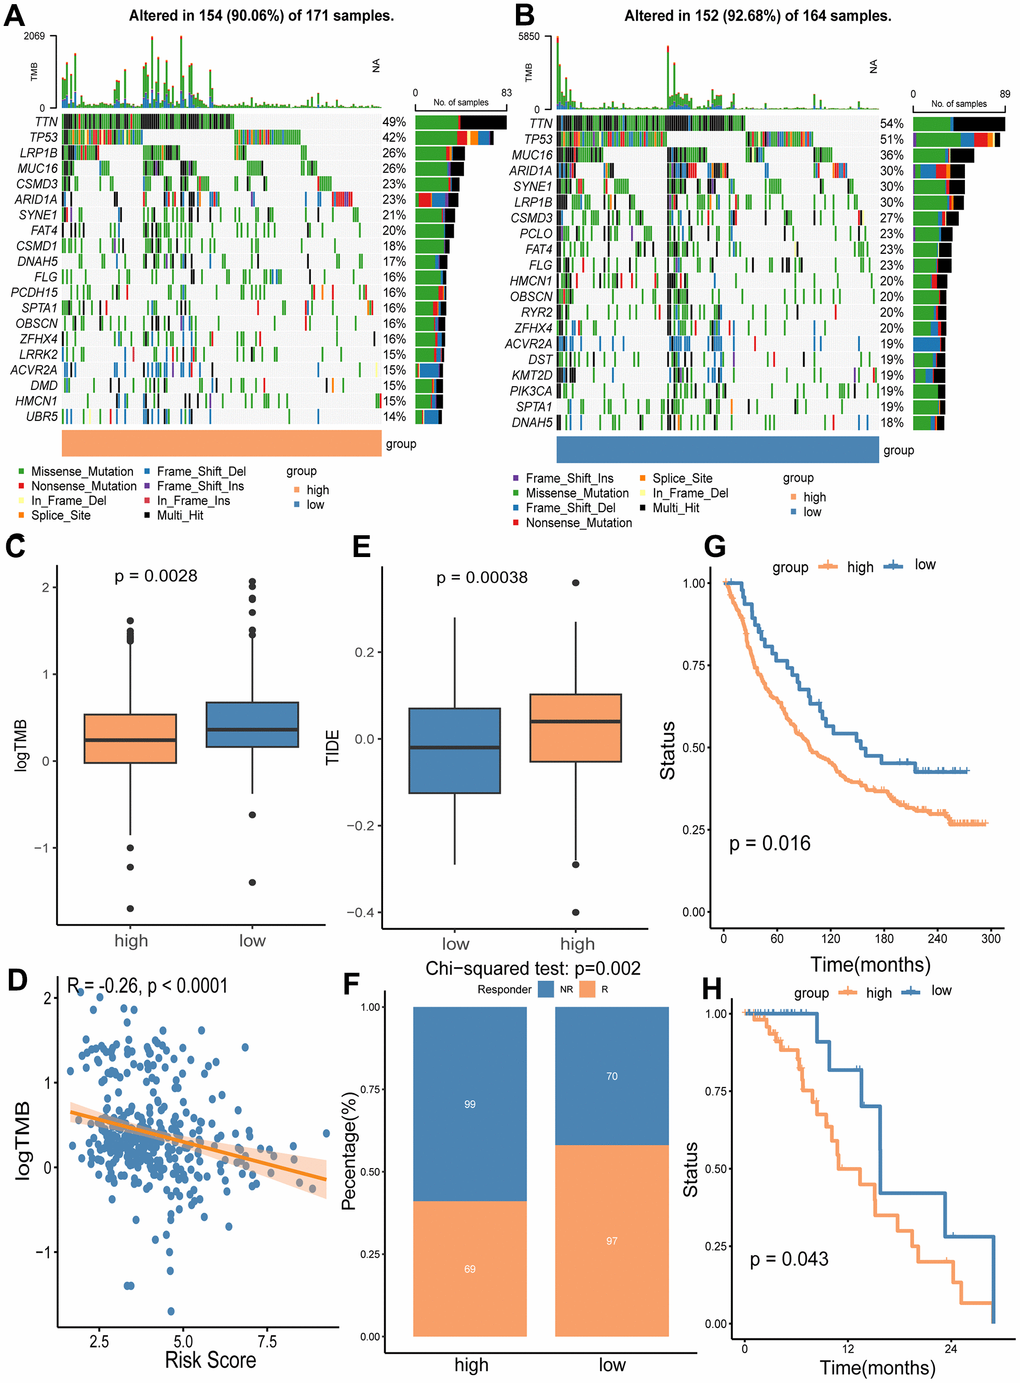
Figure 9.Analyses of somatic mutation frequency and immunotherapy response in the high/low risk groups. The waterfall plot shows the top 20 mutation genes in the high-risk group (A) and the low-risk group (B). (C) Differential TMB in the two risk groups. (D) The association analysis of TMB with the risk score. (E) Immunotherapy response prediction for the high and low risk groups using TIDE algorithm. (F) Comparison of non-responders (NR) and responders (R) between the two risk groups. (G) OS analysis of high and low risk groups in immunotherapy cohort IMvigor210. (H) OS analysis of the high and low risk groups in immunotherapy cohort GSE176307.