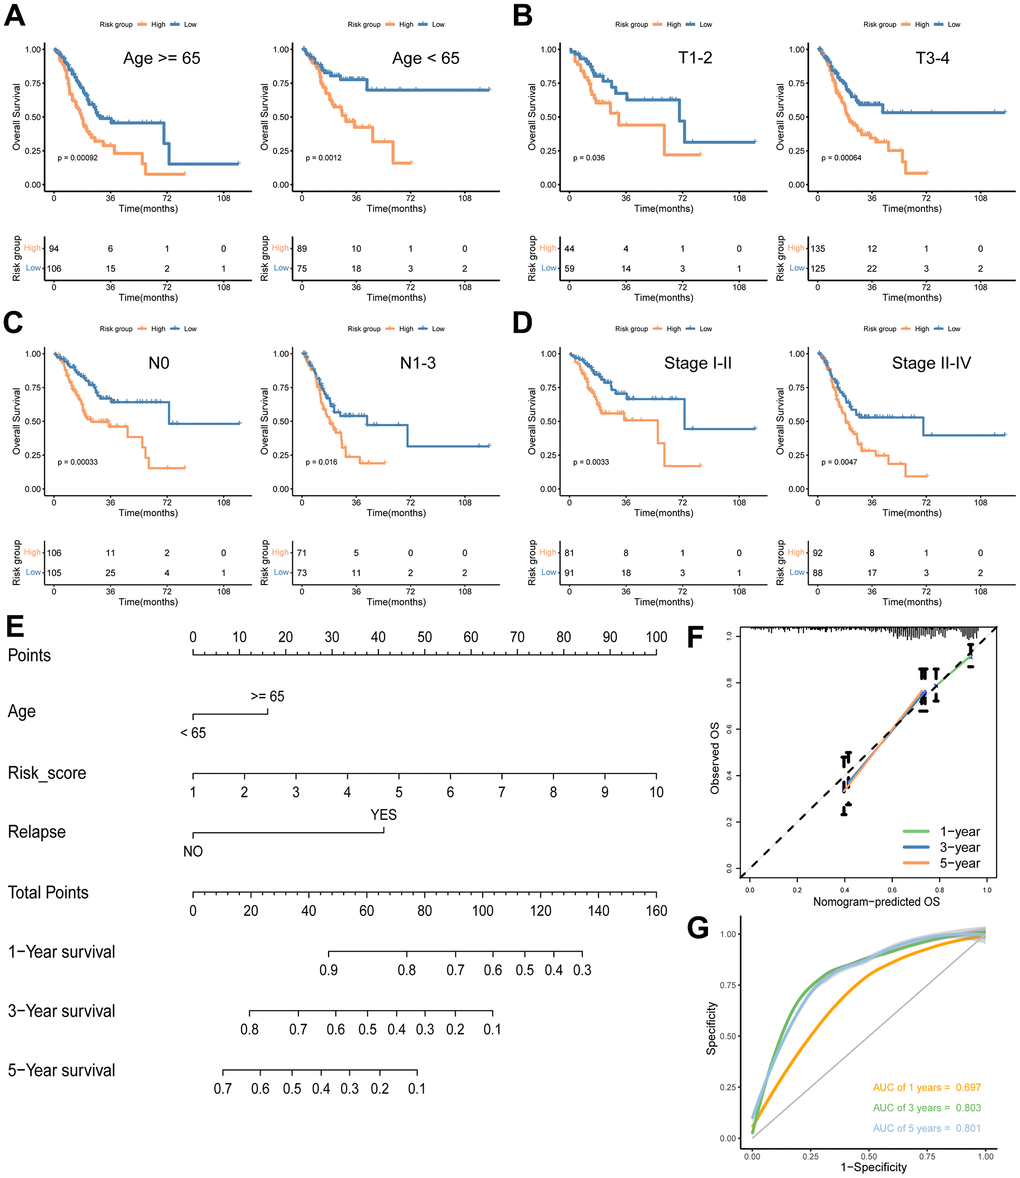
Figure 7.Analyses of associations between the signature risk score and other clinical parameters. Survival analyses according to age (A), T stage (B), N stage (C) and stage (D). (E) A nomogram including age, risk score and relapse for predicting 1-, 3-, and 5- year survival in GC. Calibration curves (F) and ROC curves (G) at 1-, 3-, and 5-year are used for determining the efficacy and reliability of the monogram.