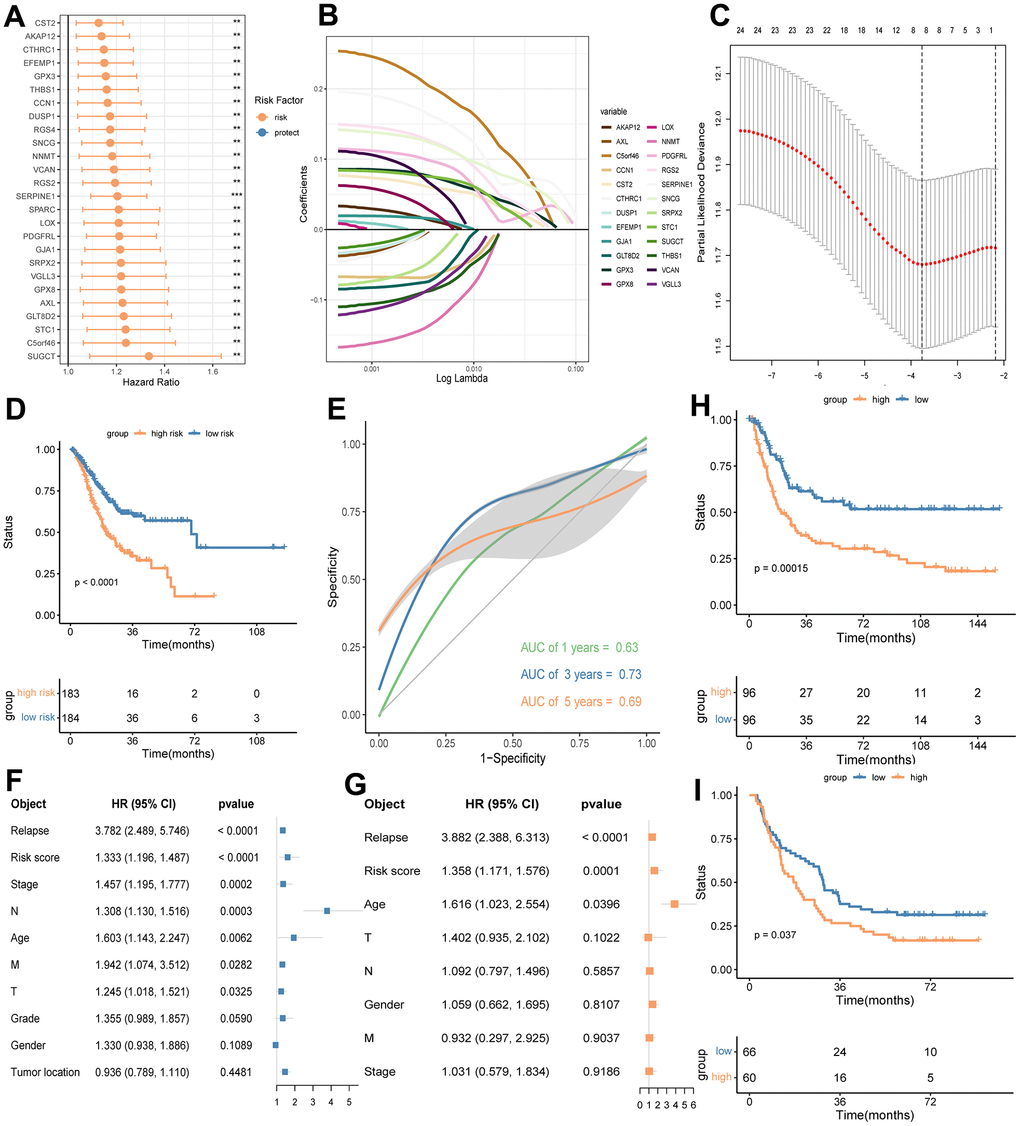
Figure 5.Identifying a prognostic eight-gene signature base on DEGs between the high and low CD8+ TSTR groups in GC. (A) HR forest plot of prognostic genes identified by a multivariate cox analysis. HR > 1 indicates risk factors. HR < 1 indicates protection factors. (B) Partial likelihood deviance coefficient profiles. (C) LASSO of the DEGs. Eight genes with the strongest predicting power are identified. (D) OS analysis for the high and low risk groups using the TCGA-GC training cohort. (E) ROC curves for 1, 3 and 5 years survival predictions using the eight-gene signature. (F) Multivariate cox regression analysis shows risk score of the eight-gene signature and other prognosis-related clinic factors. (G) Univariate cox regression analysis shows risk score of the eight-gene signature and other prognosis-related clinic factors. (H) OS analysis for the high and low risk groups using GSE15459-GC cohort. (I) OS analysis for the high and low risk groups using GSE29272-GC cohort.