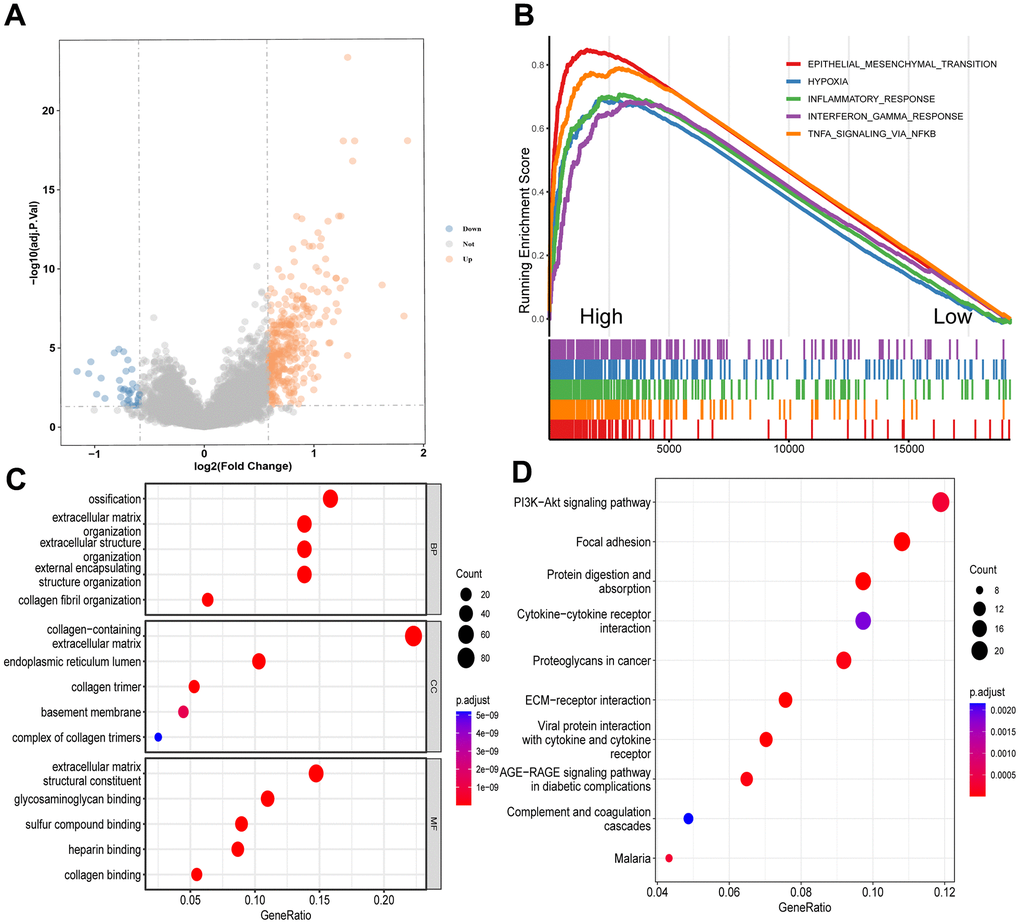
Figure 4.Enrichment analyses of DEGs between the high and low CD8+ TSTR groups. (A) Volcano plot showing the DEGs. The horizontal dashed line represents p.adjust value = 0.05. (B) GSEA analysis of the top 5 gene hallmarks. (C) GO analyses for BP, CC and MF. (D) KEGG analysis.