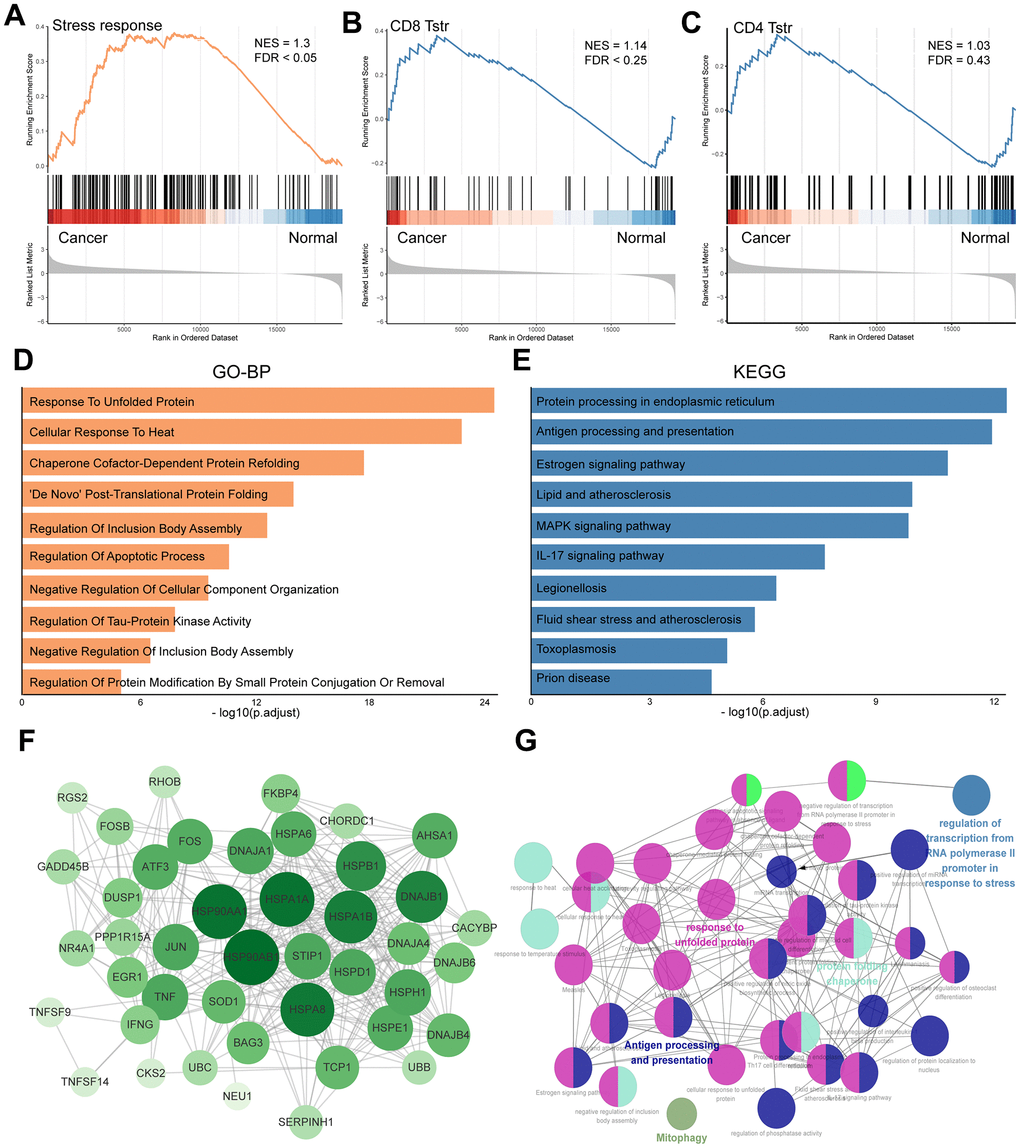
Figure 2.Profile of TSTR cells-related heat shock genes in GC. (A) GSEA enrichment analysis of TSTR cells-related heat shock genes. (B) GSEA enrichment analysis for CD8+ TSTR cells. FDR < 0.25 indicates significant. (C) GSEA enrichment analysis for CD4+ TSTR cells. FDR > 0.25 indicates not significant. (D) GO-BP enrichment analysis for CD8+ TSTR cells. (E) KEGG pathway enrichment analysis for CD8+ TSTR cells. (F) Protein-protein interaction network of top TSTR cells-related heat shock genes for CD8+ TSTR cells. (G) Potential biofunctional network associated with TSTR cells-related heat shock genes for CD8+ TSTR cells.