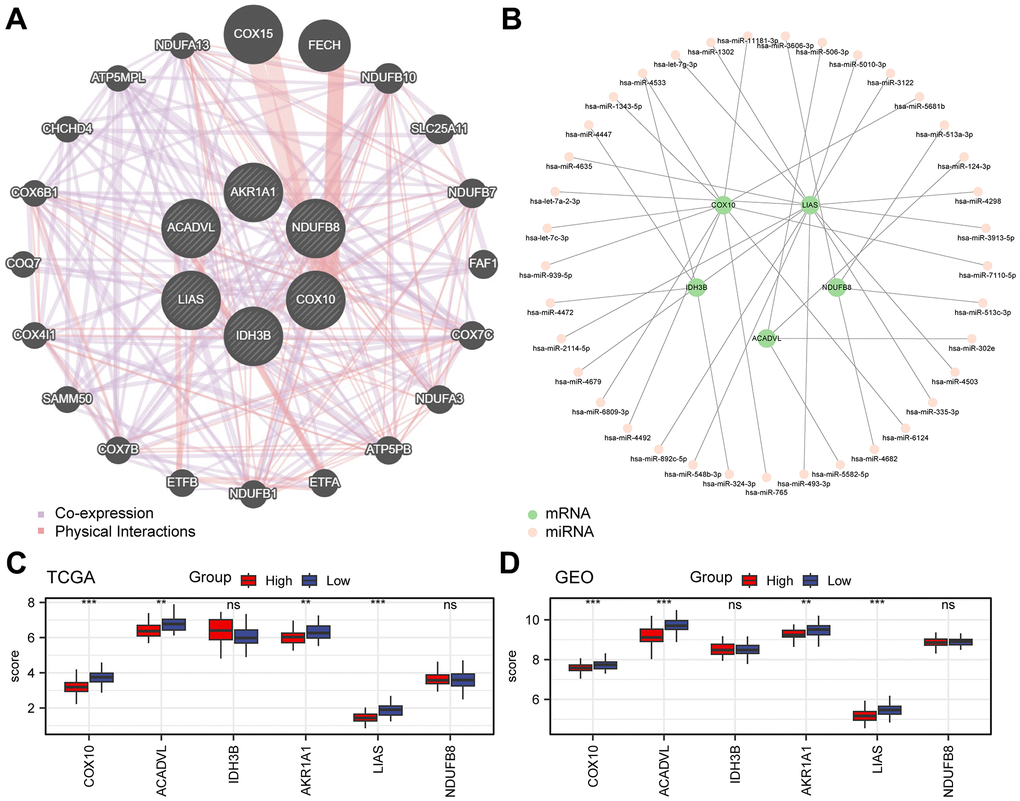
Figure 5.Analysis of key genes. (A) Interaction network of functionally related genes of key genes in the GeneMANIA website. (B) Network diagram of mRNA-miRNA. The green nodes represent the key genes (mRNA), and the pink nodes represent miRNA. (C, D) Grouped comparative graphs of high- and low-risk groups of key genes in the TCGA-ESCC dataset (C) and the combined GEO dataset (D).