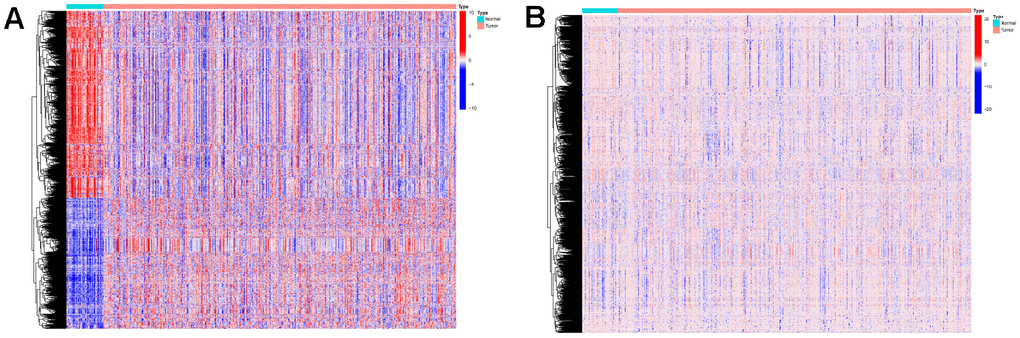
Figure 2.Expressions of the 1350 mRNAs and 1469 DNA methylation sites. (A) Heatmap (blue: low expression level; red: high expression level) of the 1350 mRNAs between the normal (N, blue) and the tumor tissues (T, red). (B) Heatmap (blue: low expression level; red: high expression level) of the 1469 DNA methylation sites between the normal (N, blue) and the tumor tissues (T, red).