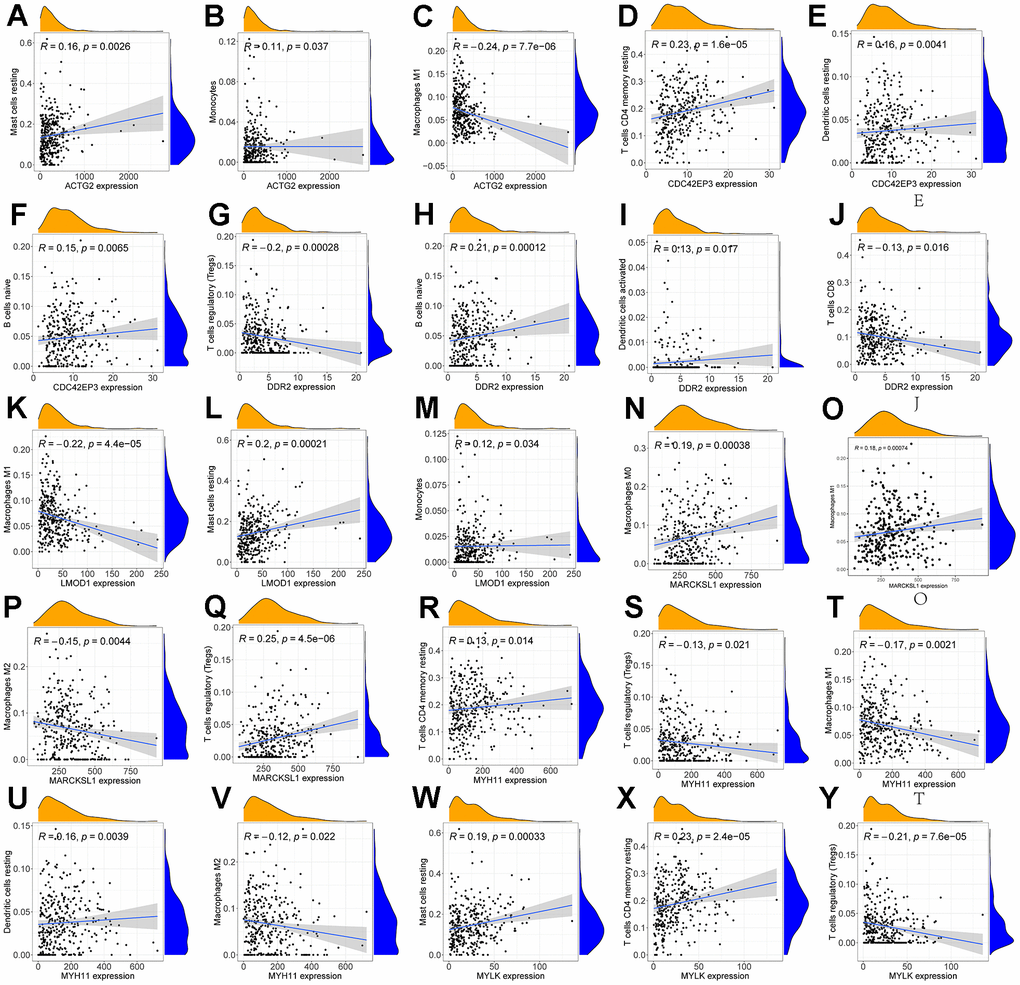
Figure 10.Correlation of immune cells with 7 mRNAs associated with prognosis. Scatter plots of the correlation between ACTG2 and immune cells are presented in (A–C). (D–F) present a scatter plot of the correlation between CDC42EP3 and immune cells. (G–J) present a scatter plot of the correlation between DDR2 and immune cells. Scatter plots of the correlation between LMOD1 and immune cells are presented in (K–M). (N–Q) give a scatter plot of the correlation between MARCKS1 and immune cells. (R–U) produced a scatter plot of the correlation between MYH11 and immune cells. (V–Y) present a scatter plot of the correlation between MYLK and immune cells.