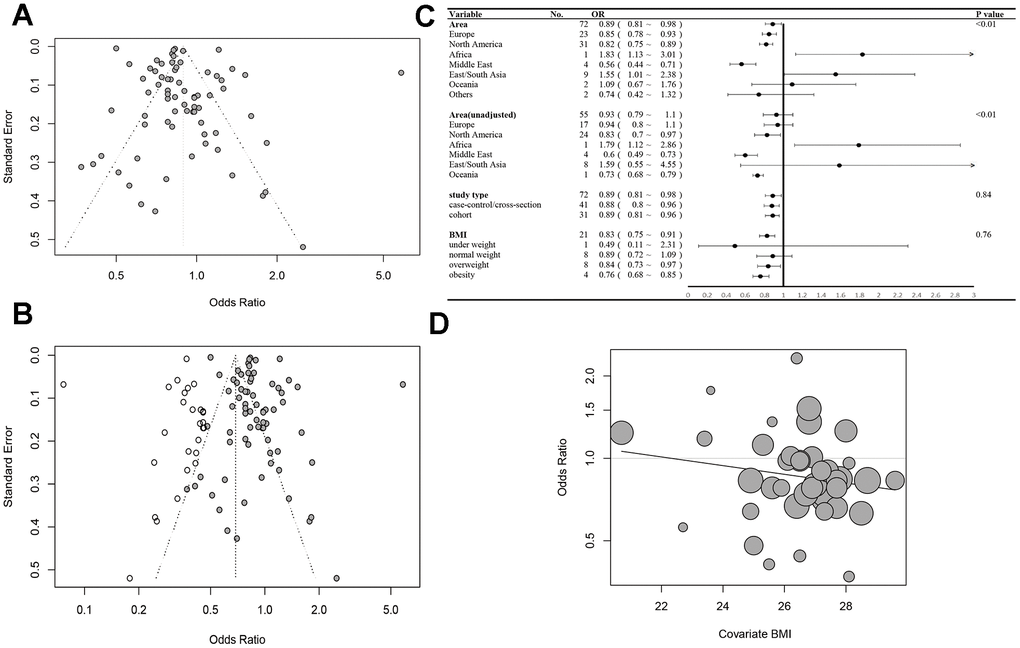
Figure 4.(A) Funnel plot of the meta-analysis. (B) The trim and fill funnel plot. (C) Subgroup analyses for OR of prostate cancer progression stratified by area, study type and BMI. (D) The meta-regression for OR of PCa and BMI.
Figure 4 — The association between diabetes mellitus and prostate cancer: a meta-analysis and Mendelian randomization | Aging