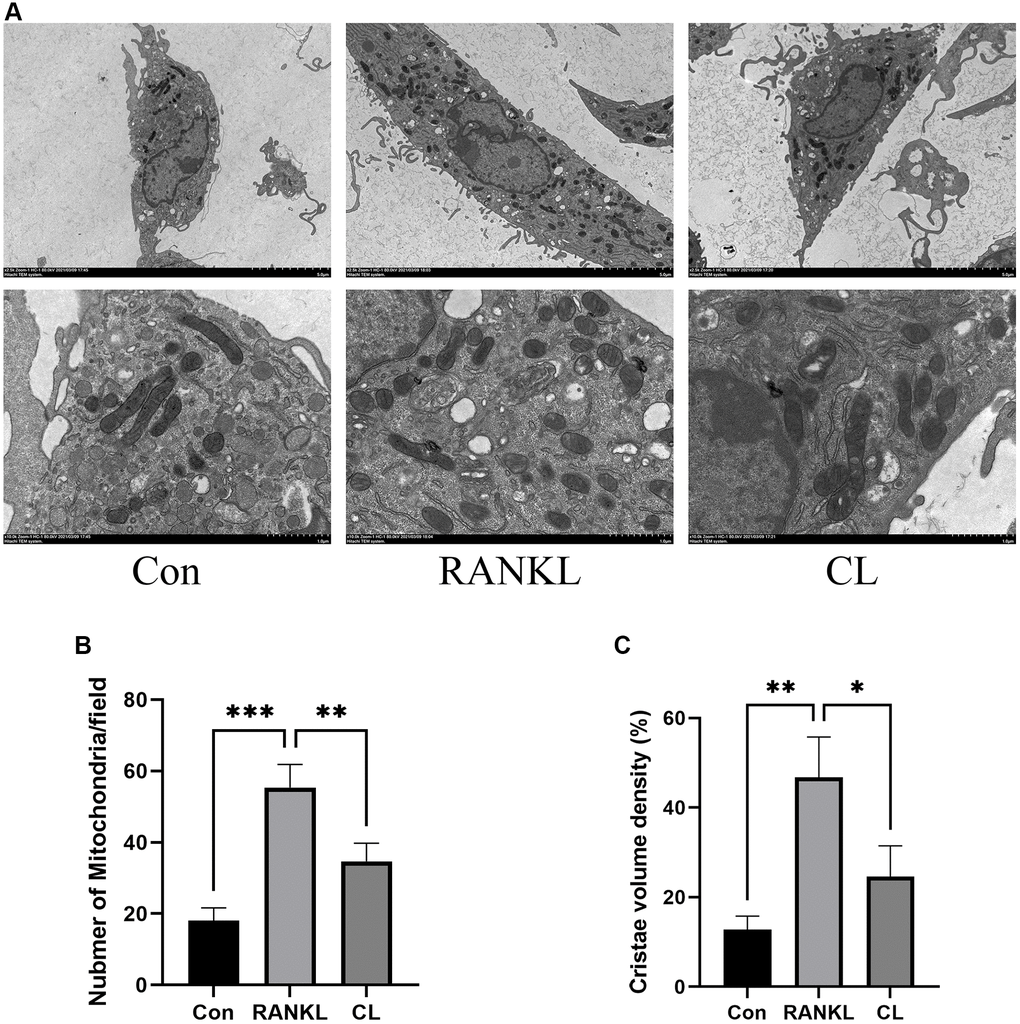
Figure 5.Inhibition of mitochondrial number and mass by CL. (A) The mitochondrial image from BMMs treated with CL under osteoclast induction condition. (B, C) The number and cristae density quantifying of mitochondria. *P < 0.05; **P < 0.01; ***P < 0.001.