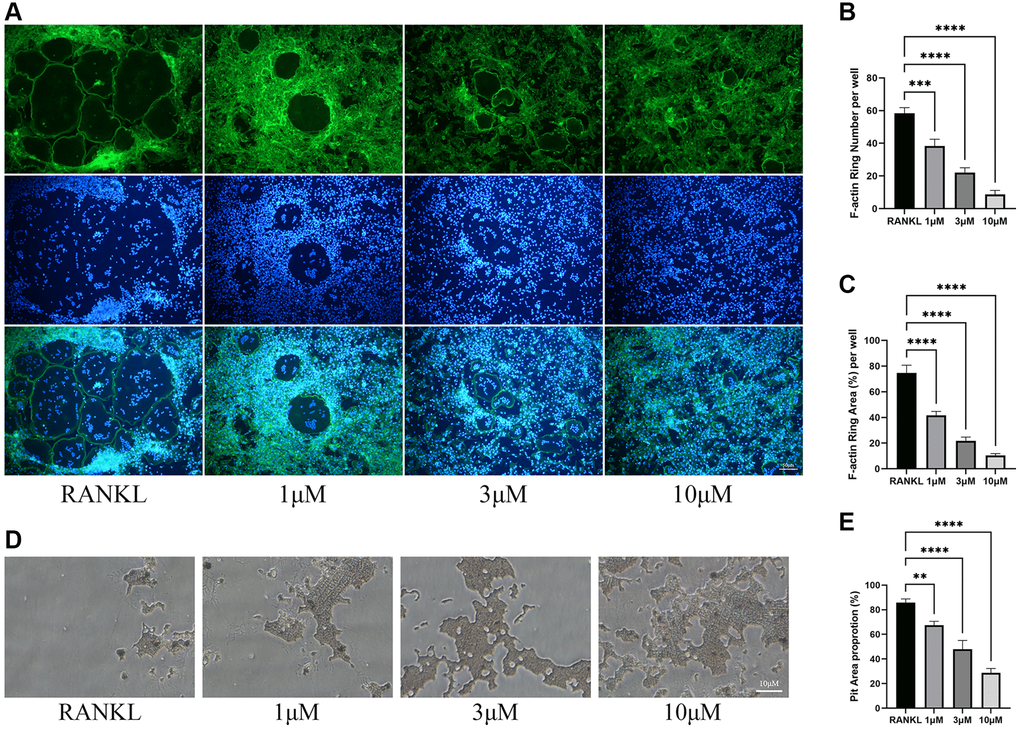
Figure 2.Inhibition of osteoclast function by CL. (A) The F-actin ring image from BMMs treated with CL under osteoclast induction condition. (B, C) The number and area quantifying of F-actin ring. (D) The bone resorption pits image form osteoclast treated with CL. (E) The area quantifying of bone resorption pits. **P < 0.01; ***P < 0.001; ****P < 0.0001.