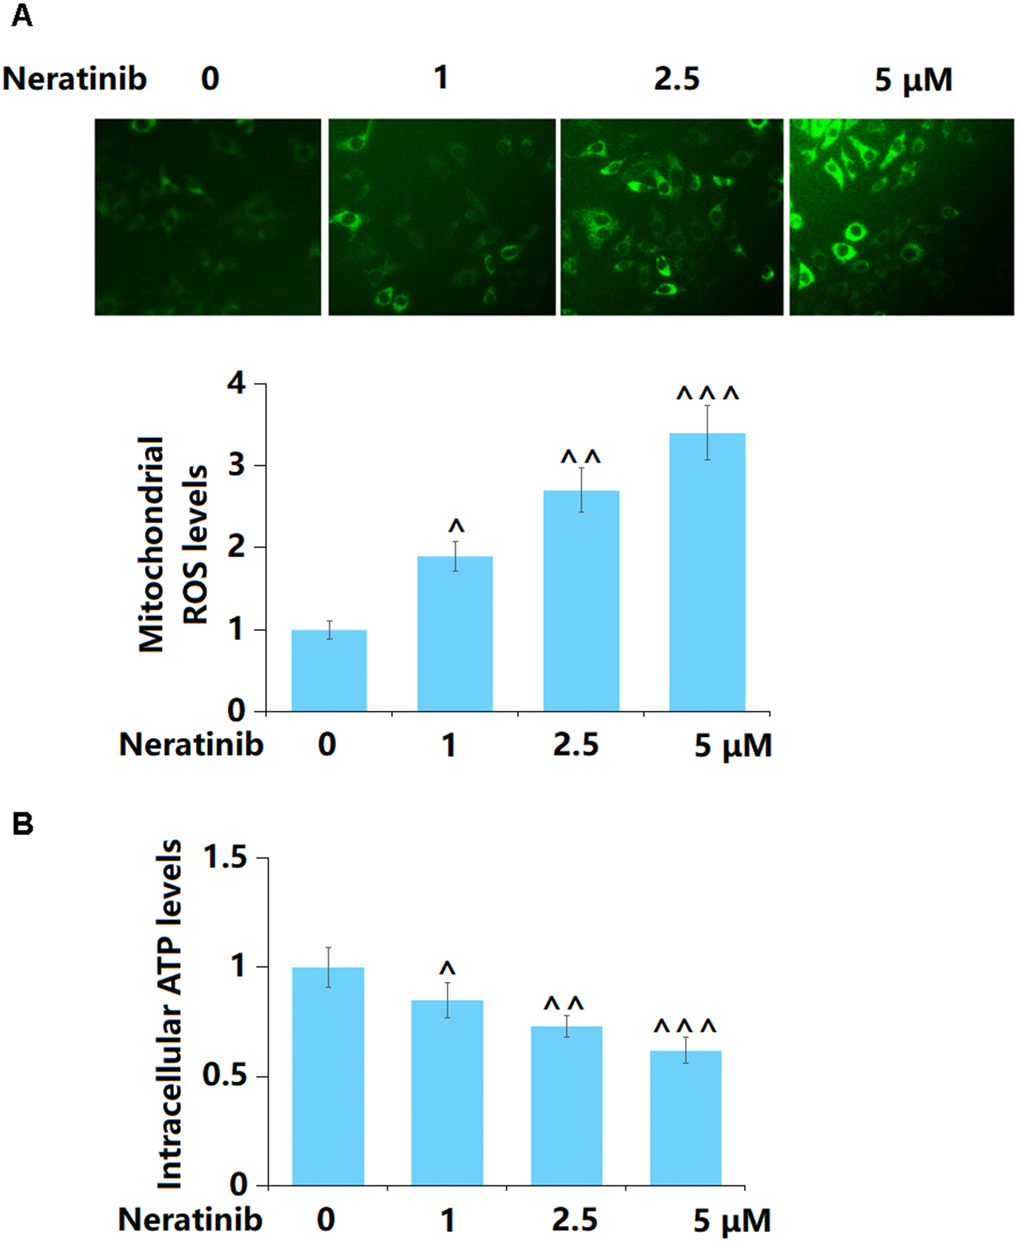
Figure 2.Neratinib induced the production of mitochondrial ROS and mitochondrial dysfunction. AU565 cells were stimulated with Neratinib (1, 2.5, 5 μM) for 36 hours. (A) The levels of mitochondrial ROS were measured using Mitosox Green; (B) The levels of intracellular ATP (^, ^^, ^^^, P<0.05, 0.01, 0.005 vs. vehicle group).