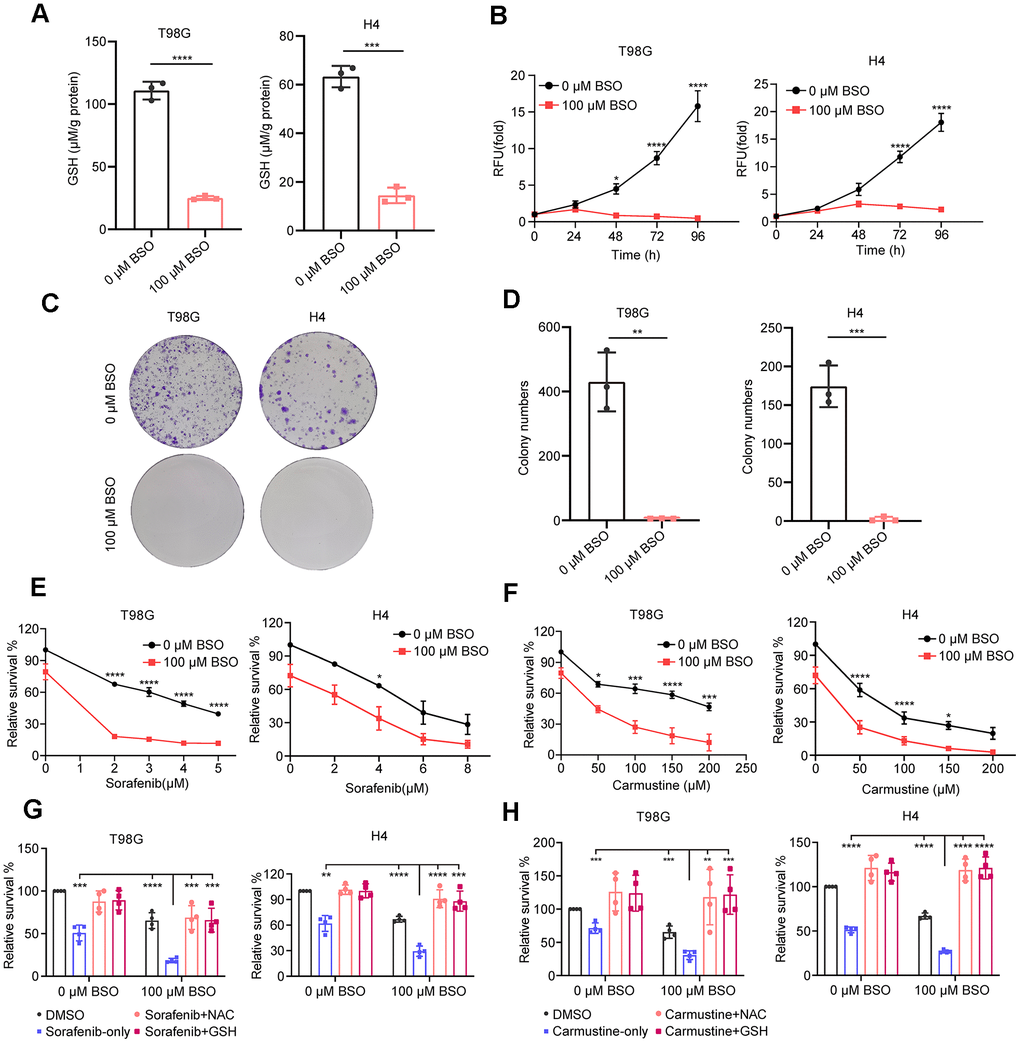
Figure 7.Effect of decreased GSH levels on glioma cell proliferation and drug resistance. (A) Measurement of glutathione content in T98G and H4 cell lines following preincubation with 100 μM L-buthionine-S,R-sulfoximine (BSO) for 24 h. (B) Effect of BSO treatment on the proliferation of T98G and H4 cell lines. (C) Colony formation results in response to BSO treatment. (D) Histograms showing the number of colonies under different experimental conditions. (E, F) Measurement of cell viability in T98G and H4 cells treated with varying concentrations of sorafenib or carmustine, either in combination with PBS or BSO (100 μM), for 24 h. (G, H) Cell viability assessment in T98G and H4 cells treated with BSO (100 μM) and sorafenib (4 μM) or carmustine (100 μM for T98G, 50 μM for H4), along with NAC (5 mM) or GSH (5 mM), for 24 hours. All data points are presented as mean ± SD from three or four independent experiments.