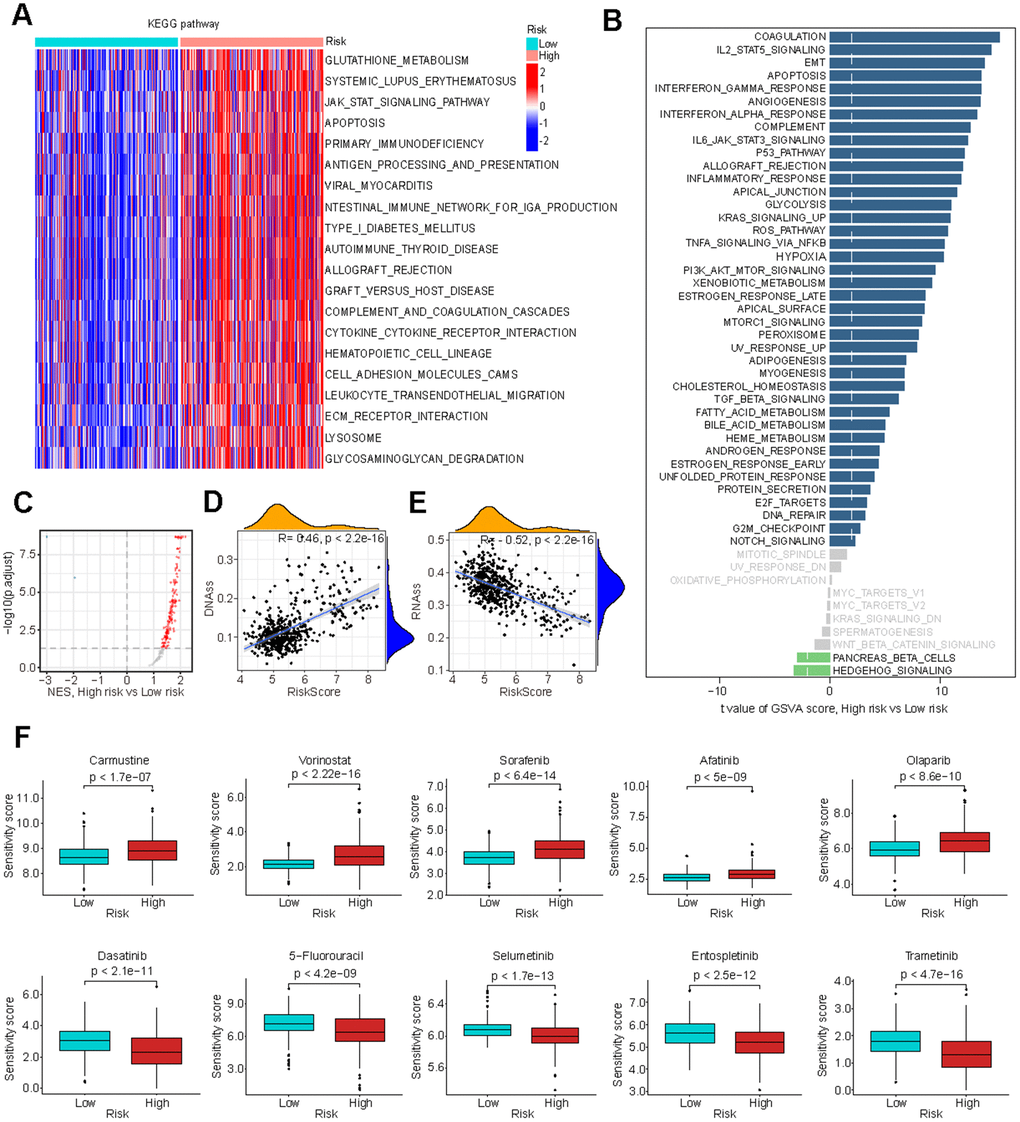
Figure 5.Biological processes associated with GMRGs-based risk score. (A) Gene set variation analysis (GSVA) depicts KEGG pathway activity differences between high-risk and low-risk groups. (B) GSVA reveals activity variation in 50 signature pathways between high-risk and low-risk groups. (C) Gene Set Enrichment Analysis (GSEA) illustrates normalized enrichment score (NES) for oncogenic signature gene sets between the high-risk and low-risk groups. (D, E) Correlation analysis of GS and tumor stem cell index based on DNAss (D) and RNAss (E). (F) Estimation of chemotherapy response for 10 potential therapeutic drugs between high-risk and low-risk groups.