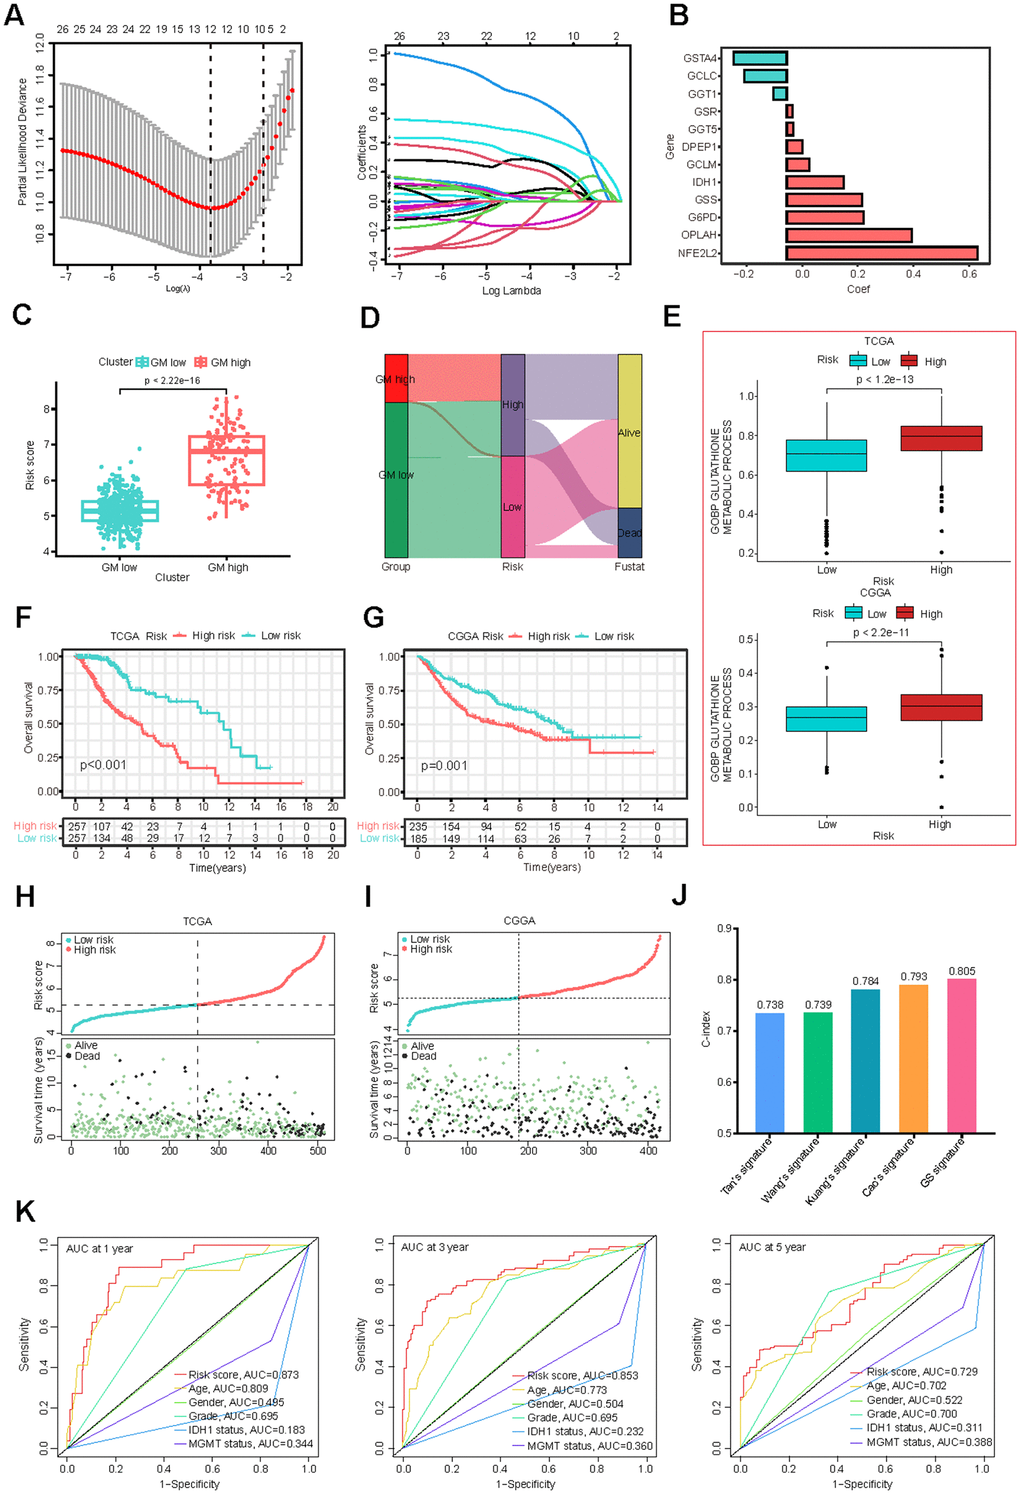
Figure 3.Construction and validation of the GMRGs-based risk score. (A) Lasso Cox regression analysis identified 12 prognostic GMRGs for signature construction. (B) Coefficients for the 12 genes. (C) Risk scores correlate with the two GMRGs-related clusters from consensus clustering. (D) The Sankey diagram demonstrates the association of GMRGs-related clusters with GMRGs-based risk score and the survival status of LGG patients. (E) Glutathione metabolism scores are associated with high-risk and low-risk groups in the TCGA-LGG and CGGA-LGG datasets. (F, G) OS curves between the high-risk and low-risk groups in the TCGA-LGG and CGGA-LGG datasets. (H, I) Distribution map of risk scores (top) and patient survival status (bottom) in the TCGA-LGG and CGGA-LGG datasets. (J) The C-index of, Tan’s, Wang’s, Kuang’s, Cao’s and our GMRGs-based risk score (GS) signatures. (K) ROC curves comparing risk score, age, gender, grade, IDH1 status, and MGMT promoter status.