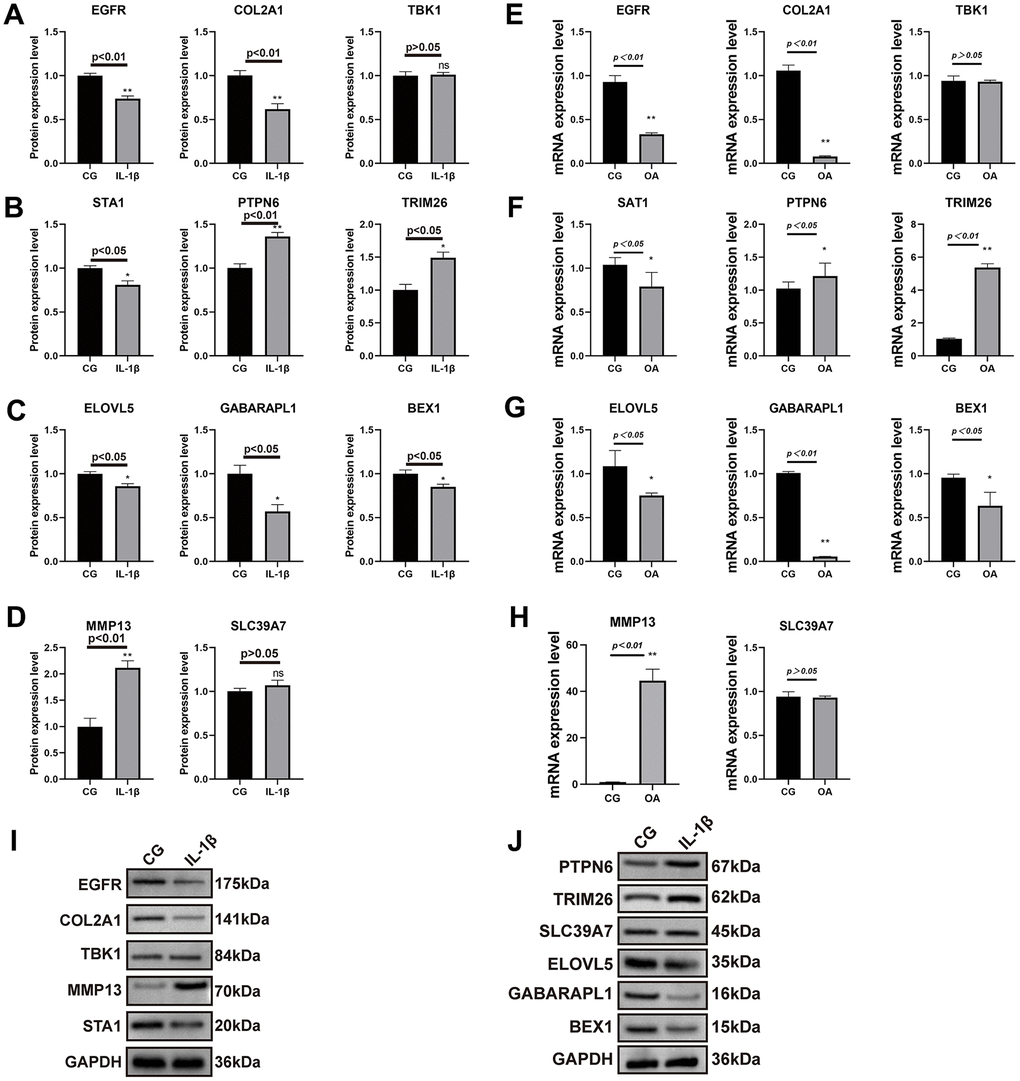
Figure 8.Results of real-time PCR and Western blot analysis. The SW1353 cell line was divided into two groups: normal chondrocytes and those with the addition of interleukin 1β (10ng/ml) intervention. The results of COL2A1 and MMP13 with GAPDH as an internal control (A–D) and real-time PCR was performed to measure the relative mRNA expression of inflammatory genes/proteins in OA (E–H). Western blotting analysis of nine key genes in two groups (I, J).