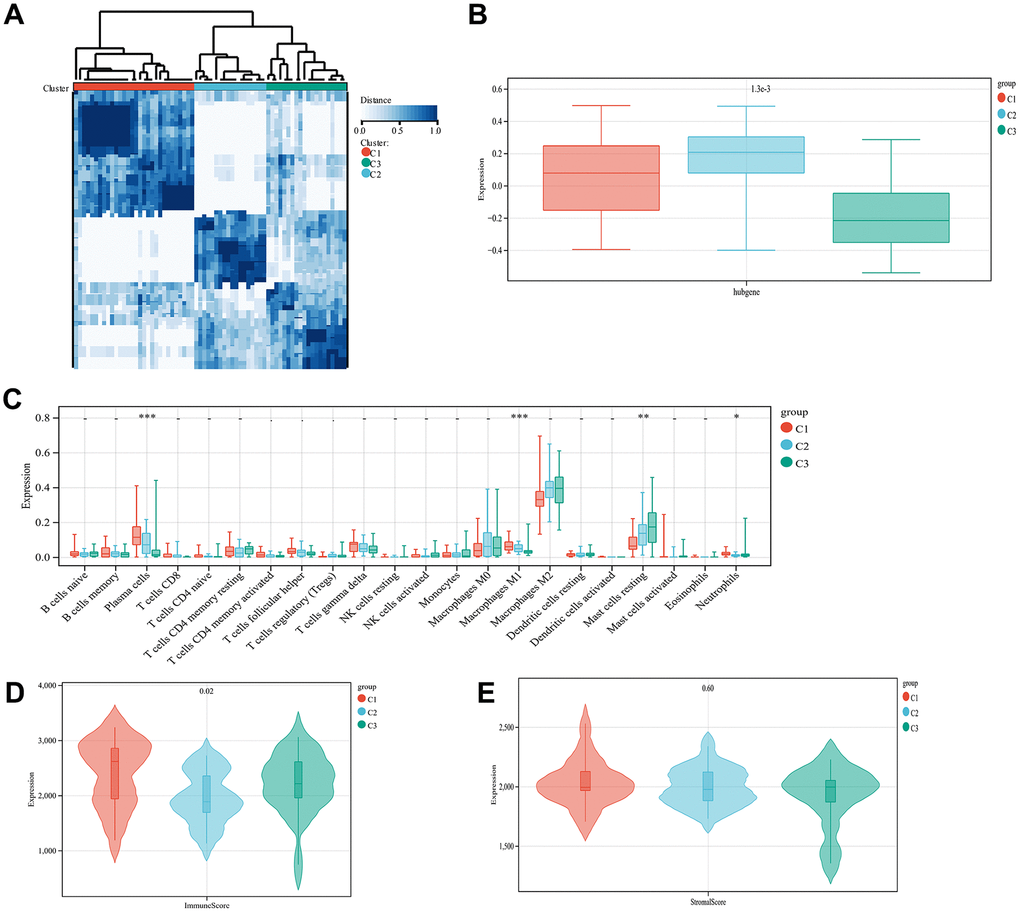
Figure 7.Unsupervised cluster analysis. Sample subtype analysis clustering chart (A). Comparison of diagnostic gene scores between different subtype groups (B). Showing the distribution of various types of immune cells in samples from different subtype groups (C). The distribution of immune scores in different subtype groups of samples is displayed (D). The distribution of stromal scores in the samples of different subtype groups is displayed (E).