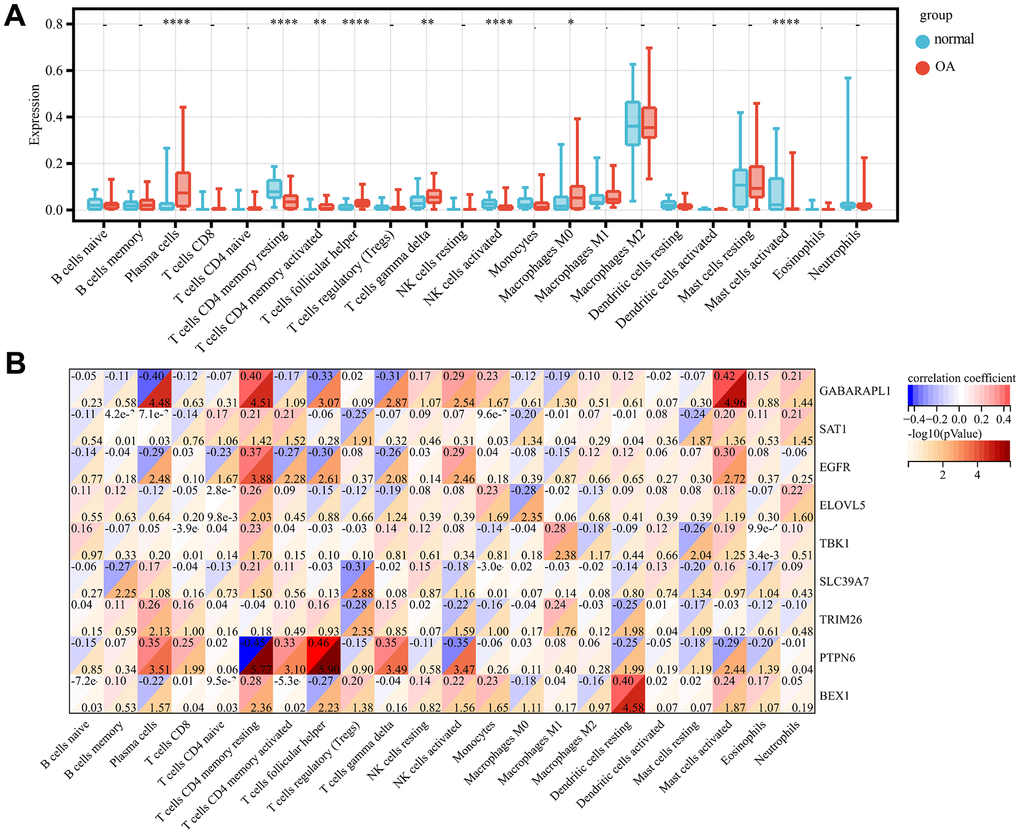
Figure 6.Immune infiltration analysis. Comparison of the proportion of 22 immune cell types in OA and normal samples (A). Heat map display of 9 diagnostic genes with immune cell correlation (B). p-value<0.0001: “****”, p-value<0.001: “***”, p-value<0.01: “**”, p-value<0.05: “*”.