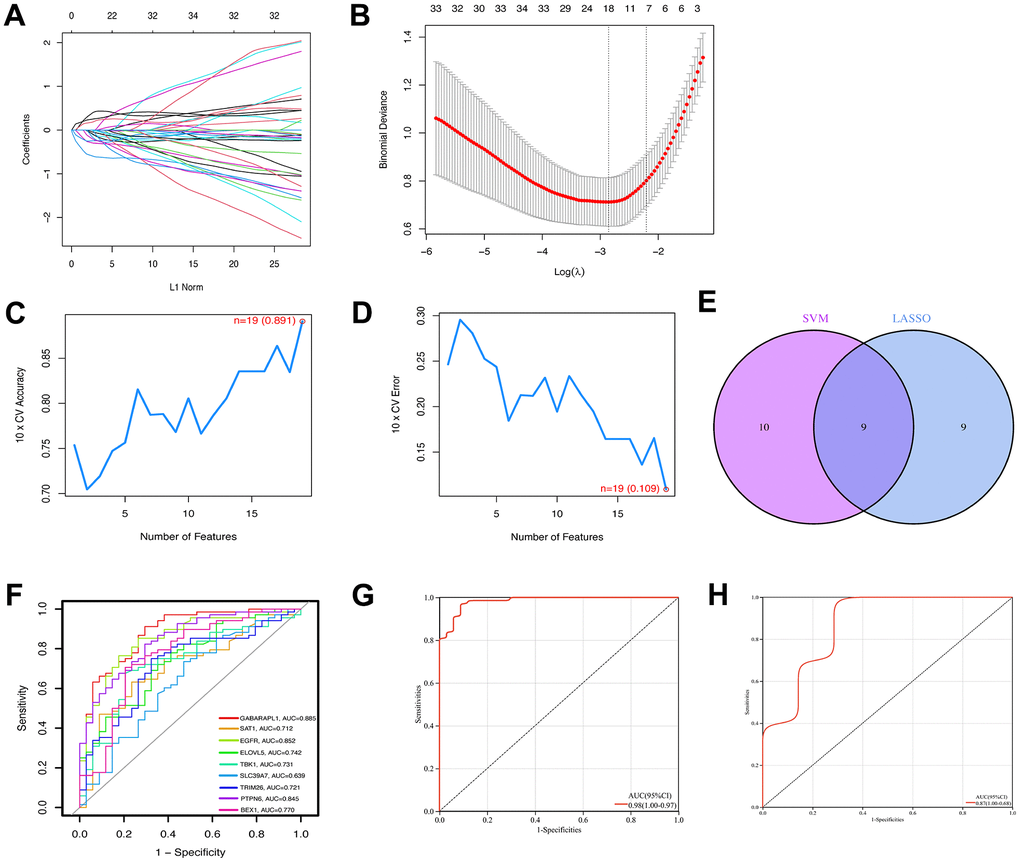
Figure 4.Construction of ferroptosis signature using machine learning algorithms. The LASSO coefficient profiles of the 9 co-expressional ferroptosis genes (A). The optimal lambda value was selected in the LASSO regression model based on 10-fold cross-validation (B). The line graph shows the cross-validated accuracy based on different numbers of ferroptosis genes in the SVM-RFE model (C and D). The 19 genes with the highest cross-validation accuracy (C) and the lowest error (D) were selected. Screening of nine key ferroptosis genes (E) using LASSO and SVM-RFE machine learning algorithms. ROC curves for the 9 marker genes (F). Logistic regression model to identify the AUC (G) of ferroptosis-related osteoarthritis samples. Model validation of disease diagnosis models in the independent validation dataset GSE82107 (H).