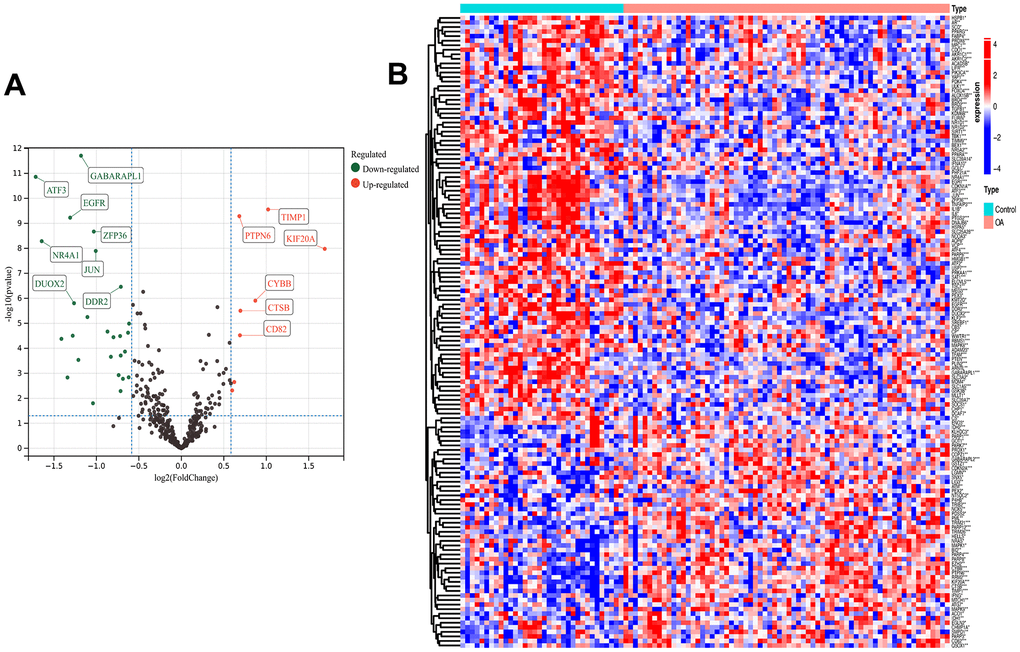
Figure 2.Differential analysis. Ferroptosis-related differentially expressed genes (FRGs) volcano plot (A) with log2FoldChange in the horizontal coordinate and -log10(P-value) in the vertical coordinate. Red nodes indicate upregulated FRGs, green nodes indicate downregulated FRGs, and black nodes indicate genes that are not significantly differentially expressed. Heat map (B) of ferroptosis-related DEG expression levels: p-value<0.001: “***”, p-value<0.01: “**”, p-value<0.05: “*”.