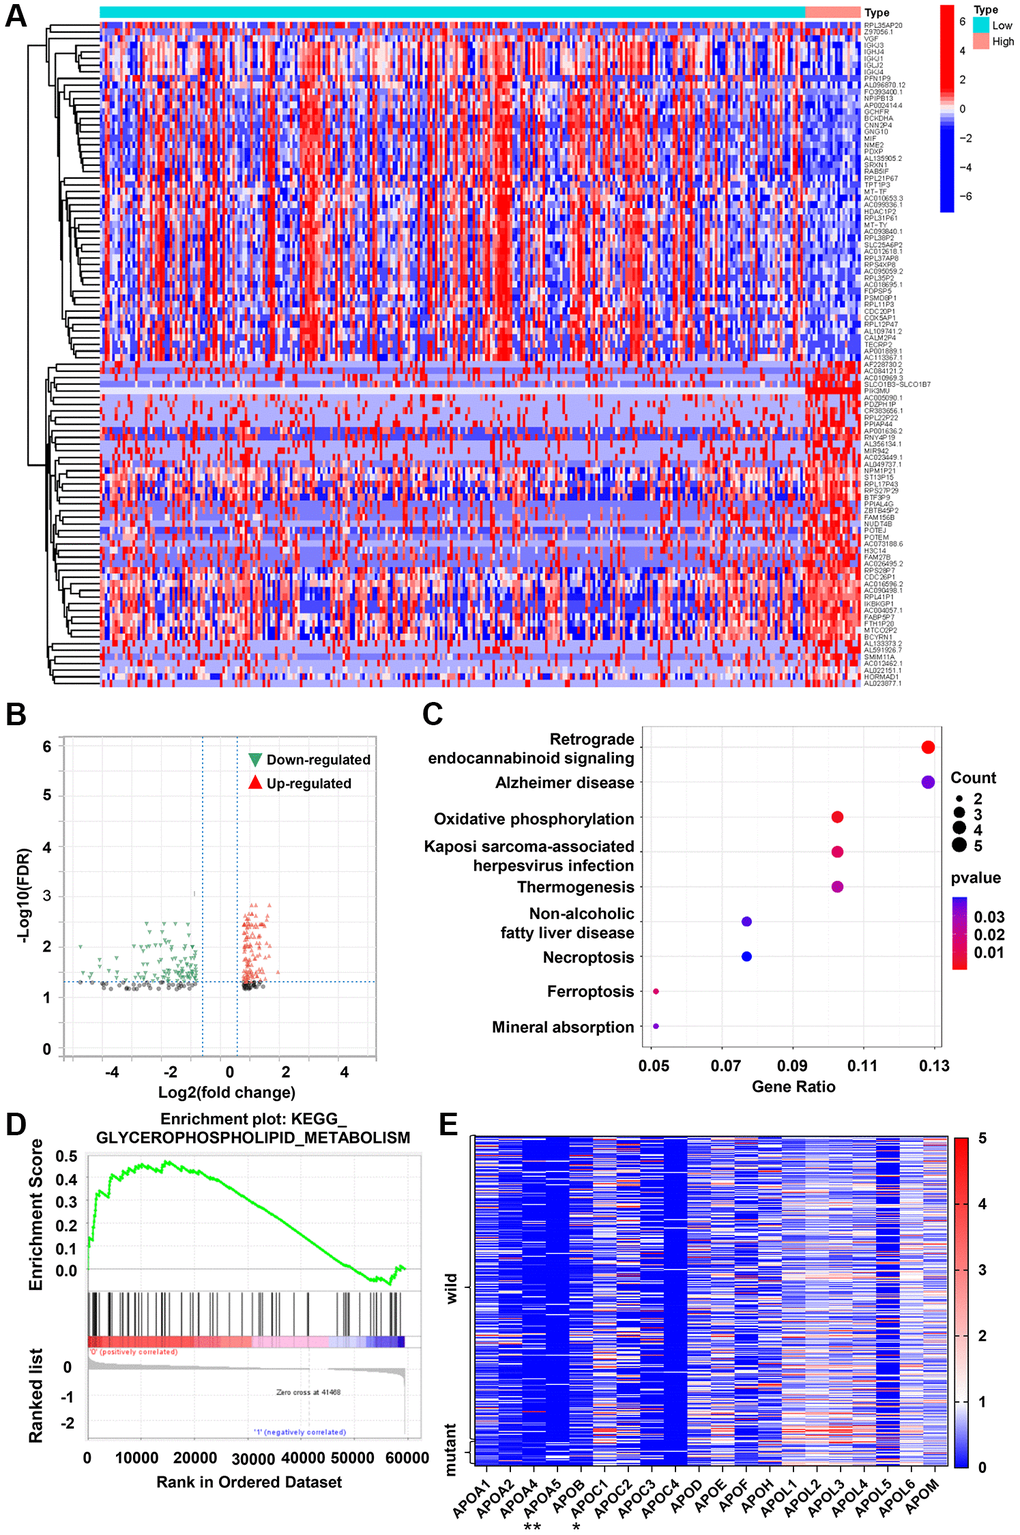
Figure 2.PIK3CA mutant CRC tissues exhibits increased APOA5 expression. (A) Heatmap for DEGs generated by comparison of wild-type vs. mutant PIK3CA group in colon cancer samples. The row name of heatmap is the gene name, and the column represents each sample in the cohort. (B) Volcano plot for the DEGs. The blue and red dots represented the significantly downregulated and upregulated genes, respectively; and the gray dots represented the genes without differential expression. DEGs were determined by Wilcoxon rank sum test with FDR <0.05 and |log2 FC| >1 as the significance threshold. (C) KEGG enrichment analysis for 244 DEGs, terms with p and q < 0.05 were believed to be enriched significantly. (D) Enriched gene sets in C2 collection by the PIK3CA mutant samples expression. Up-regulated genes are located on the left which approach the origin of the coordinates (p < 0.05 and FDR q < 0.25). (E) Differentiated expression of apolipoproteins in the wild-type and mutant PIK3CA sample. **p < 0.001, *p = 0.016 by Wilcoxon rank sum test.