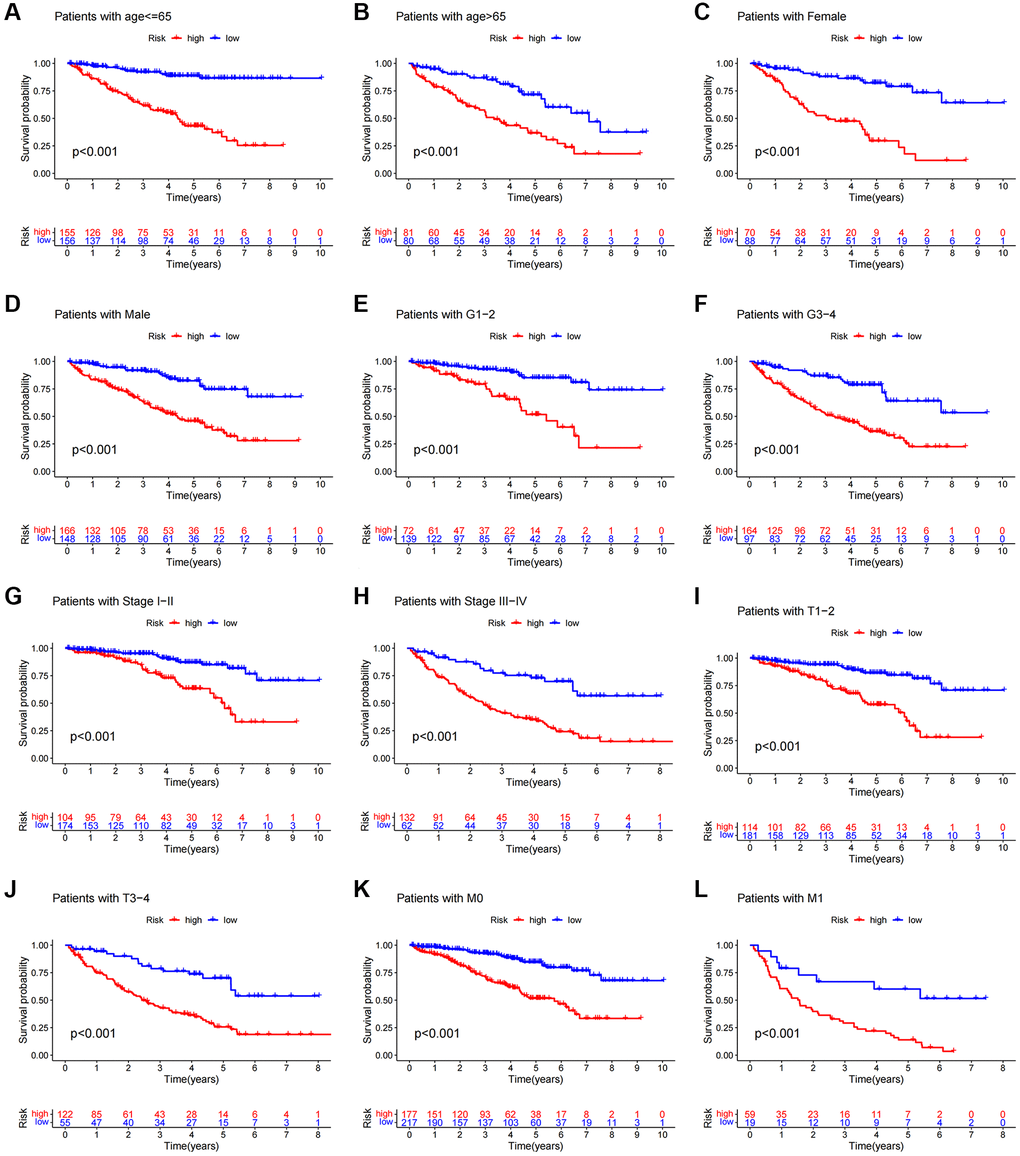
Figure 6.Kaplan-Meier survival curves of patients divided into high- and low-risk groups according to the ranking of different clinicopathological variables. (A, B) Age. (C, D) Gender. (E, F) Grade. (G, H) Stage. (I, J) T Stage. (K, L) M Stage. T, tumor size. M, distant metastasis.