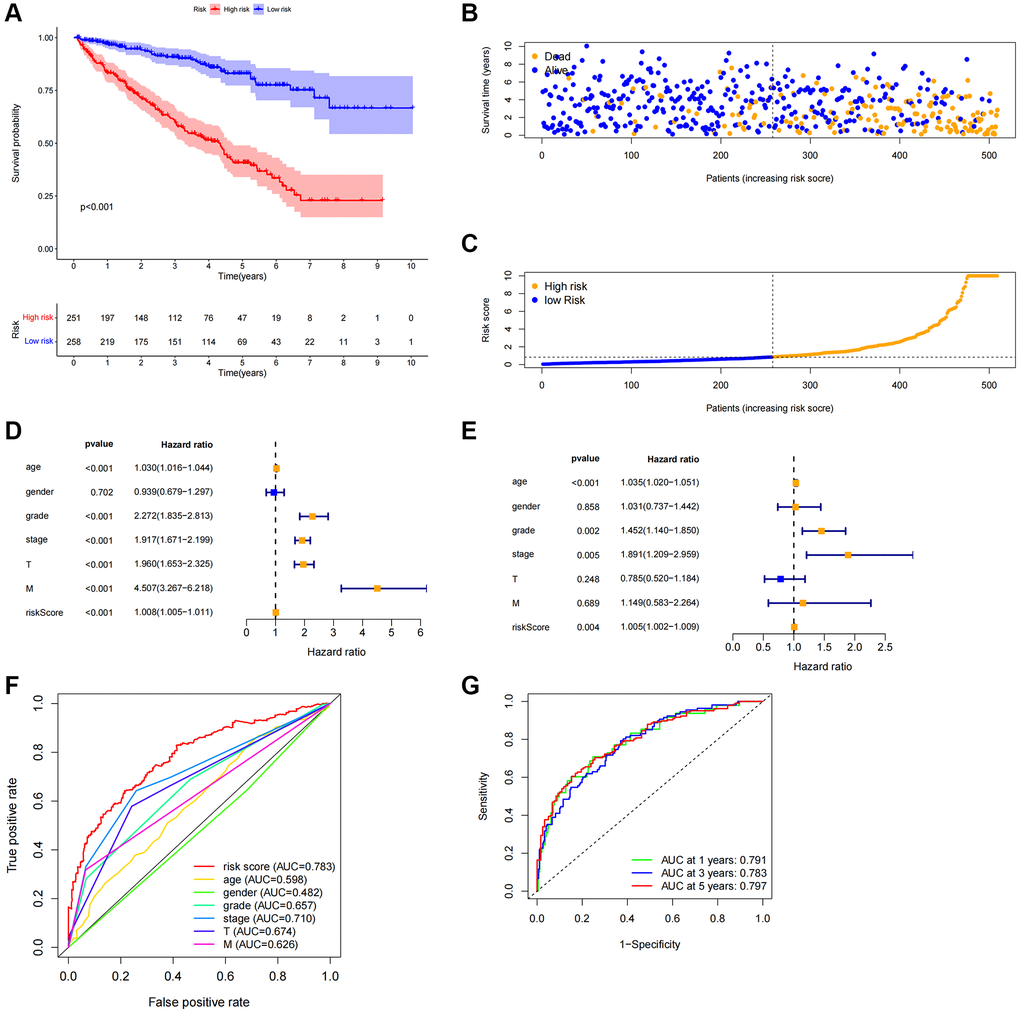
Figure 4.Correlation between predictive characteristics and prognosis of ccRCC patients. (A) Kaplan-Meier analysis of OS rate in patients with high and low risk. (B) Risk score distribution in patients with ccRCC. (C) The total number of patients with varying risk scores who died and survived. Red denotes the number of deaths, and blue is the number of survivors. (D) The univariate Cox regression analysis’s forest plot. (E) Multivariate Cox regression analysis’s forest plot. (F) Risk score and clinicopathological variable ROC curve. (G) The ROC curve and AUCs are used to estimate the survival rates of features after one, three, and five years. Abbreviations: ccRCC: renal clear cell carcinoma; OS: survival rate; ROC: receiver operating characteristic; AUC: area under the curve; T: tumor; M: metastasis.