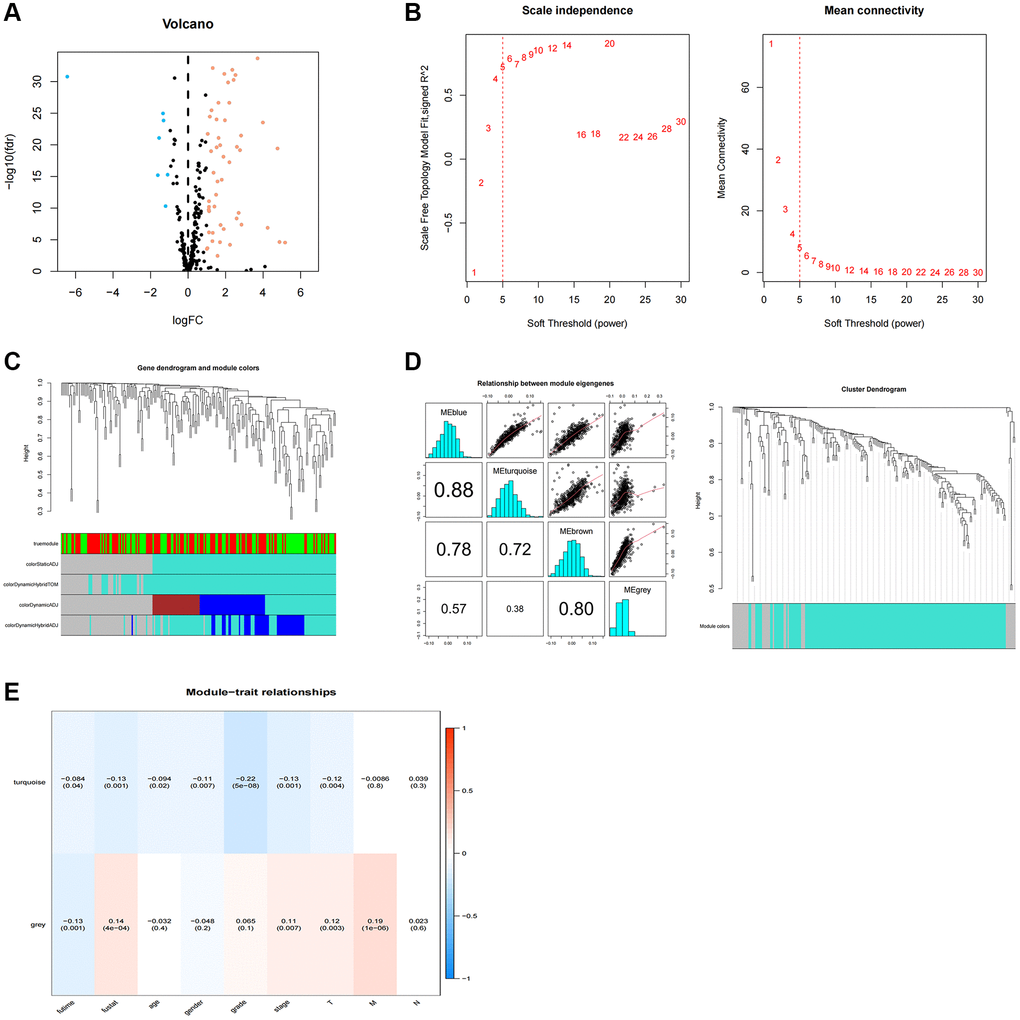
Figure 1.WGCNA analysis of differentially expressed telomerase-associated genes. (A) 256 TR-related genes in ccRCC. Yellow dots indicate up-regulated genes and blue dots indicate down-regulated genes. (B) Cluster analysis of samples. (C) Gene dendrogram and module colors. (D) Cluster-based gene dendrogram. (E) Correlations of modules with clinical phenotypes.