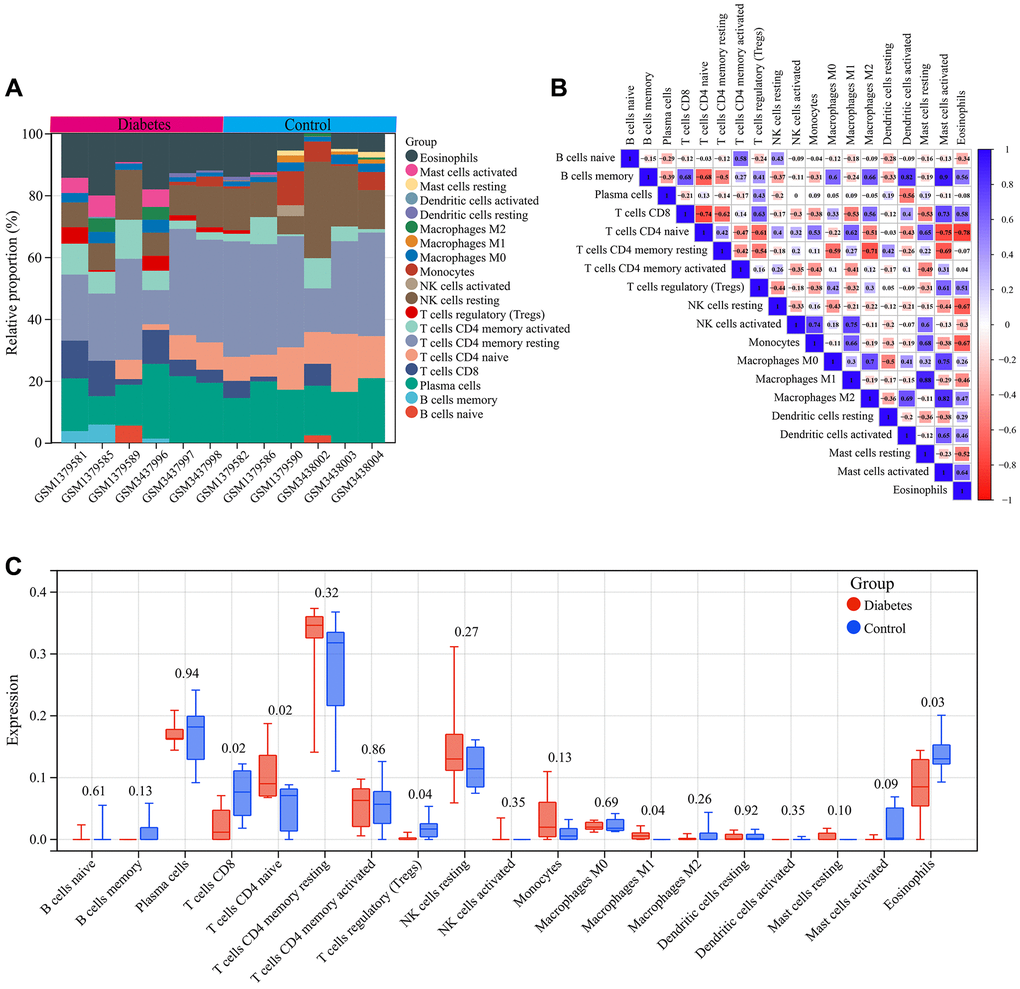
Figure 5.Immune infiltration analysis. (A) Bar graph of immune cell infiltration in each vascular sample. (B) Correlation between 19 characteristic immune cells. (C) Comparison of the infiltration of 19 immune cell types in the vascular samples of the diabetes and control groups.