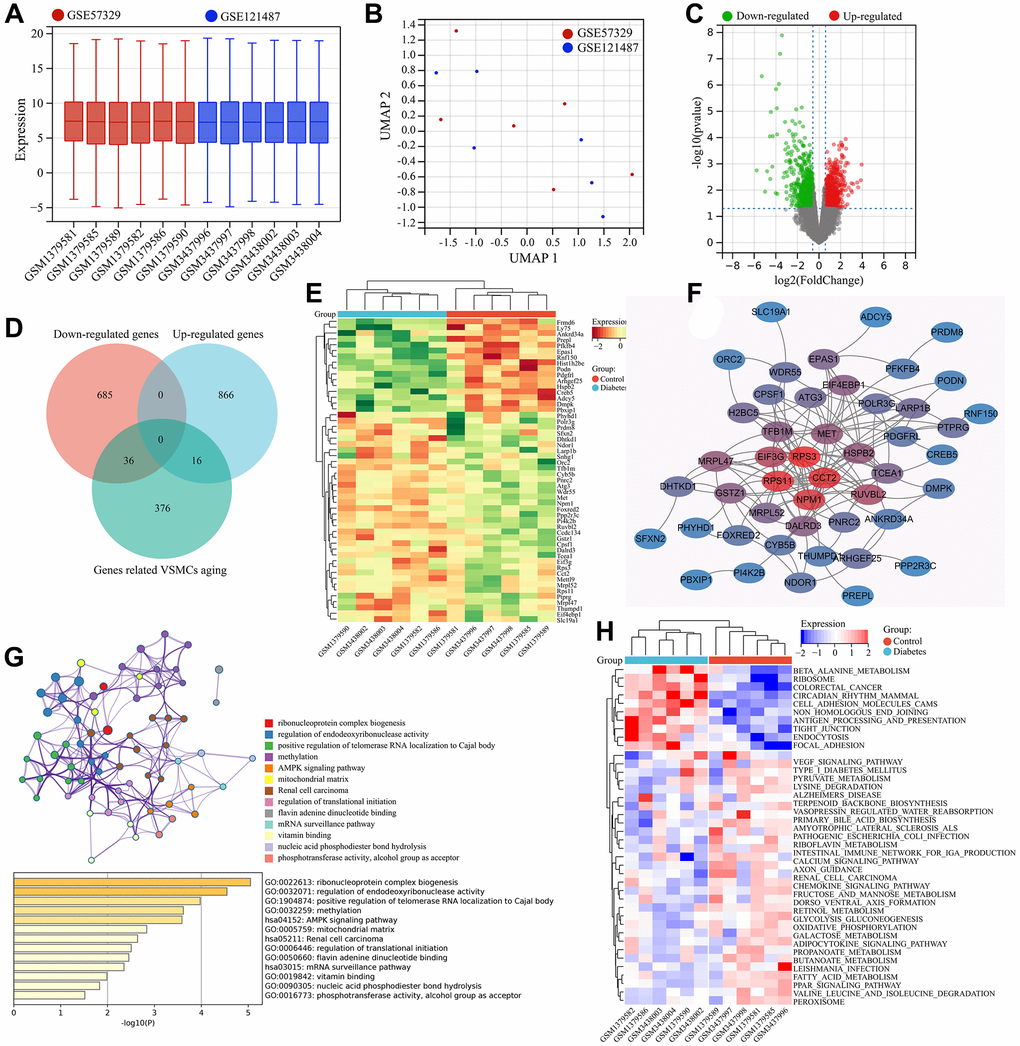
Figure 3.Screening and functional enrichment analysis of diabetic vascular aging-related genes. (A) Boxplots of gene expressions after the removal of inter-batch effect. (B) UMAP analysis after the removal of inter-batch effect. (C) Volcano plot of differential expression analysis. (D) Identification of common DEGs (diabetic vascular aging-related genes). (E) Heatmap of gene expression for diabetic vascular aging-related genes. (F) PPI analysis of diabetic vascular aging-related genes. (G) KEGG and GO enrichment analysis of diabetic vascular aging-related genes. (H) Heatmap of differentially expressed signaling pathways (GSVA).